2 Introduction to Ancient DNA
The field of palaeogenomics focuses on the study of ancient DNA, and traces its origins to the 1980s. This chapter provides a brief overview of the methodological history of the field and reviews the fundamentals of how ancient DNA is recovered, sequenced, and authenticated today. Emphasis is placed on how DNA degrades and how DNA degradation patterns are used to help authenticate ancient DNA at the level of sequences, genomes, and samples, as well as how DNA damage creates both opportunities and downstream challenges when genotyping or generating phylogenies.
2.1 Ancient DNA beginnings
The origins of the field of palaeogenomics can be traced back to 1984 with the publication of the first ancient DNA study by Russell Higuichi and colleagues (Higuchi et al. 1984). Working in Allan Wilson’s lab at the University of California at Berkeley, Higuchi investigated DNA from a museum soft tissue specimen of the quagga, a subspecies of zebra that had gone extinct in the late 19th century (Figure 2.1). Compared to today, 1984 was a very different world in terms of technological capabilities within biology and genetics. To help put this into perspective, Figure 2.1 shows the DNA sequences that were published in this first paper. They consist of partial DNA sequences from two mitochondrial genes – cytochrome oxidase I and a second unidentified gene that was later determined to be NADH dehydrogenase I. Sequencing these two short segments of DNA required an enormous amount of time and effort to achieve, and all of the work was analog. In fact, most of the digital tools we take for granted today did not yet exist in 1984. Journals did not have websites, manuscripts were submitted by post, and genetic data was mostly tabulated and analysed by hand. Microsoft Excel, which is today a kind of ubiquitous software for basic spreadsheet data manipulation, wasn’t even invented and released until 1985 (for Mac) and 1987 (for Windows).

This first ancient DNA study, published at the very beginning of the era of genetic sequencing in the journal Nature, illustrates what an important achievement it was in the 1980s to be able to sequence even this small amount of quagga DNA. However, the methods they used are very different from the methods we use today. Higuchi and colleagues achieved the genetic sequencing reported in their paper using a technique called primed-synthesis dideoxynucleoside chain-termination sequencing, a method that had been developed by Frederick Sanger and colleagues only seven years before in 1977 (Sanger, Nicklen, and Coulson 1977). Sanger’s method, which came to be known as Sanger Sequencing, was the first truly successful and useful method for sequencing DNA, and it became the primary method of DNA sequencing for the next 35 years. This was a breakthrough moment in the history of genetics, and it is worth exploring how the method works.
In the previous chapter, you learned some of the basic concepts of DNA sequencing that are used for next generation sequencing (NGS). NGS builds upon the basic principles of the original Sanger method, and so it is worth examining the Sanger method in more detail here. The Sanger method works by using a DNA polymerase to copy a large pool of identical DNA templates using a mixture of ordinary nucleotides and nucleotides containing a blocking component. As the polymerase extends along each DNA template molecule, it incorporates the available nucleotides, and when it incorporates a blocking nucleotide it prematurely stops. The random incorporation of blocking nucleotides at different points along the template molecules results in DNA of different extension lengths, which can then be separated and ordered by size using gel electrophoresis. In the original Sanger method, each round of sequencing required four separate reactions - each containing blocking nucleotides for a different base. Following gel electrophoresis, the different banding patterns of the four reactions could then be used to determine the base present at each particular position in the sequence, and thus determining the overall DNA sequence of the template.
Figure 2.2 shows an example of how this works from another early ancient DNA study by Matthias Höss and Svante Pääbo on a different extinct equid (Höss and Pääbo 1993). The bands are “read” from bottom to top, which represents the 5’ to 3’ orientation of the template molecule. The four lanes of the gel represent the four separate polymerase extension reactions, each containing a mixture of ordinary nucleotides and blocking nucleotides corresponding to the base annotated at the top of each lane. The shortest DNA sequences travel fastest through the gel and are visualised as bands at the bottom of the gel; these represent the beginning of the DNA sequence. The longest DNA sequences travel more slowly through the gel and are visualised as bands at the top; these represent the end of the DNA sequence. Determining the DNA sequence was initially an entirely analogue process generally carried out with a ruler and pencil. Band by band, the bases would be recorded from bottom to top, resulting in a consensus sequence. This process, setting aside the prior laboratory work necessary to produce sufficient template DNA for sequencing, would itself have taken a full workday in order to set up the reactions, perform the extensions, run the gel, image the gel, develop the film, and then manually read out the DNA sequences. Although automated sequencing and basecalling first became available for the Sanger method in 1987 with the release of the Applied Biosystems ABI 370 instrument, which utilised fluorophores instead of radioactive molecules to detect the DNA bases (making it safer) and a personal computer for digital basecalling (making it faster), analog methods continued to be widely used well into the 1990s.
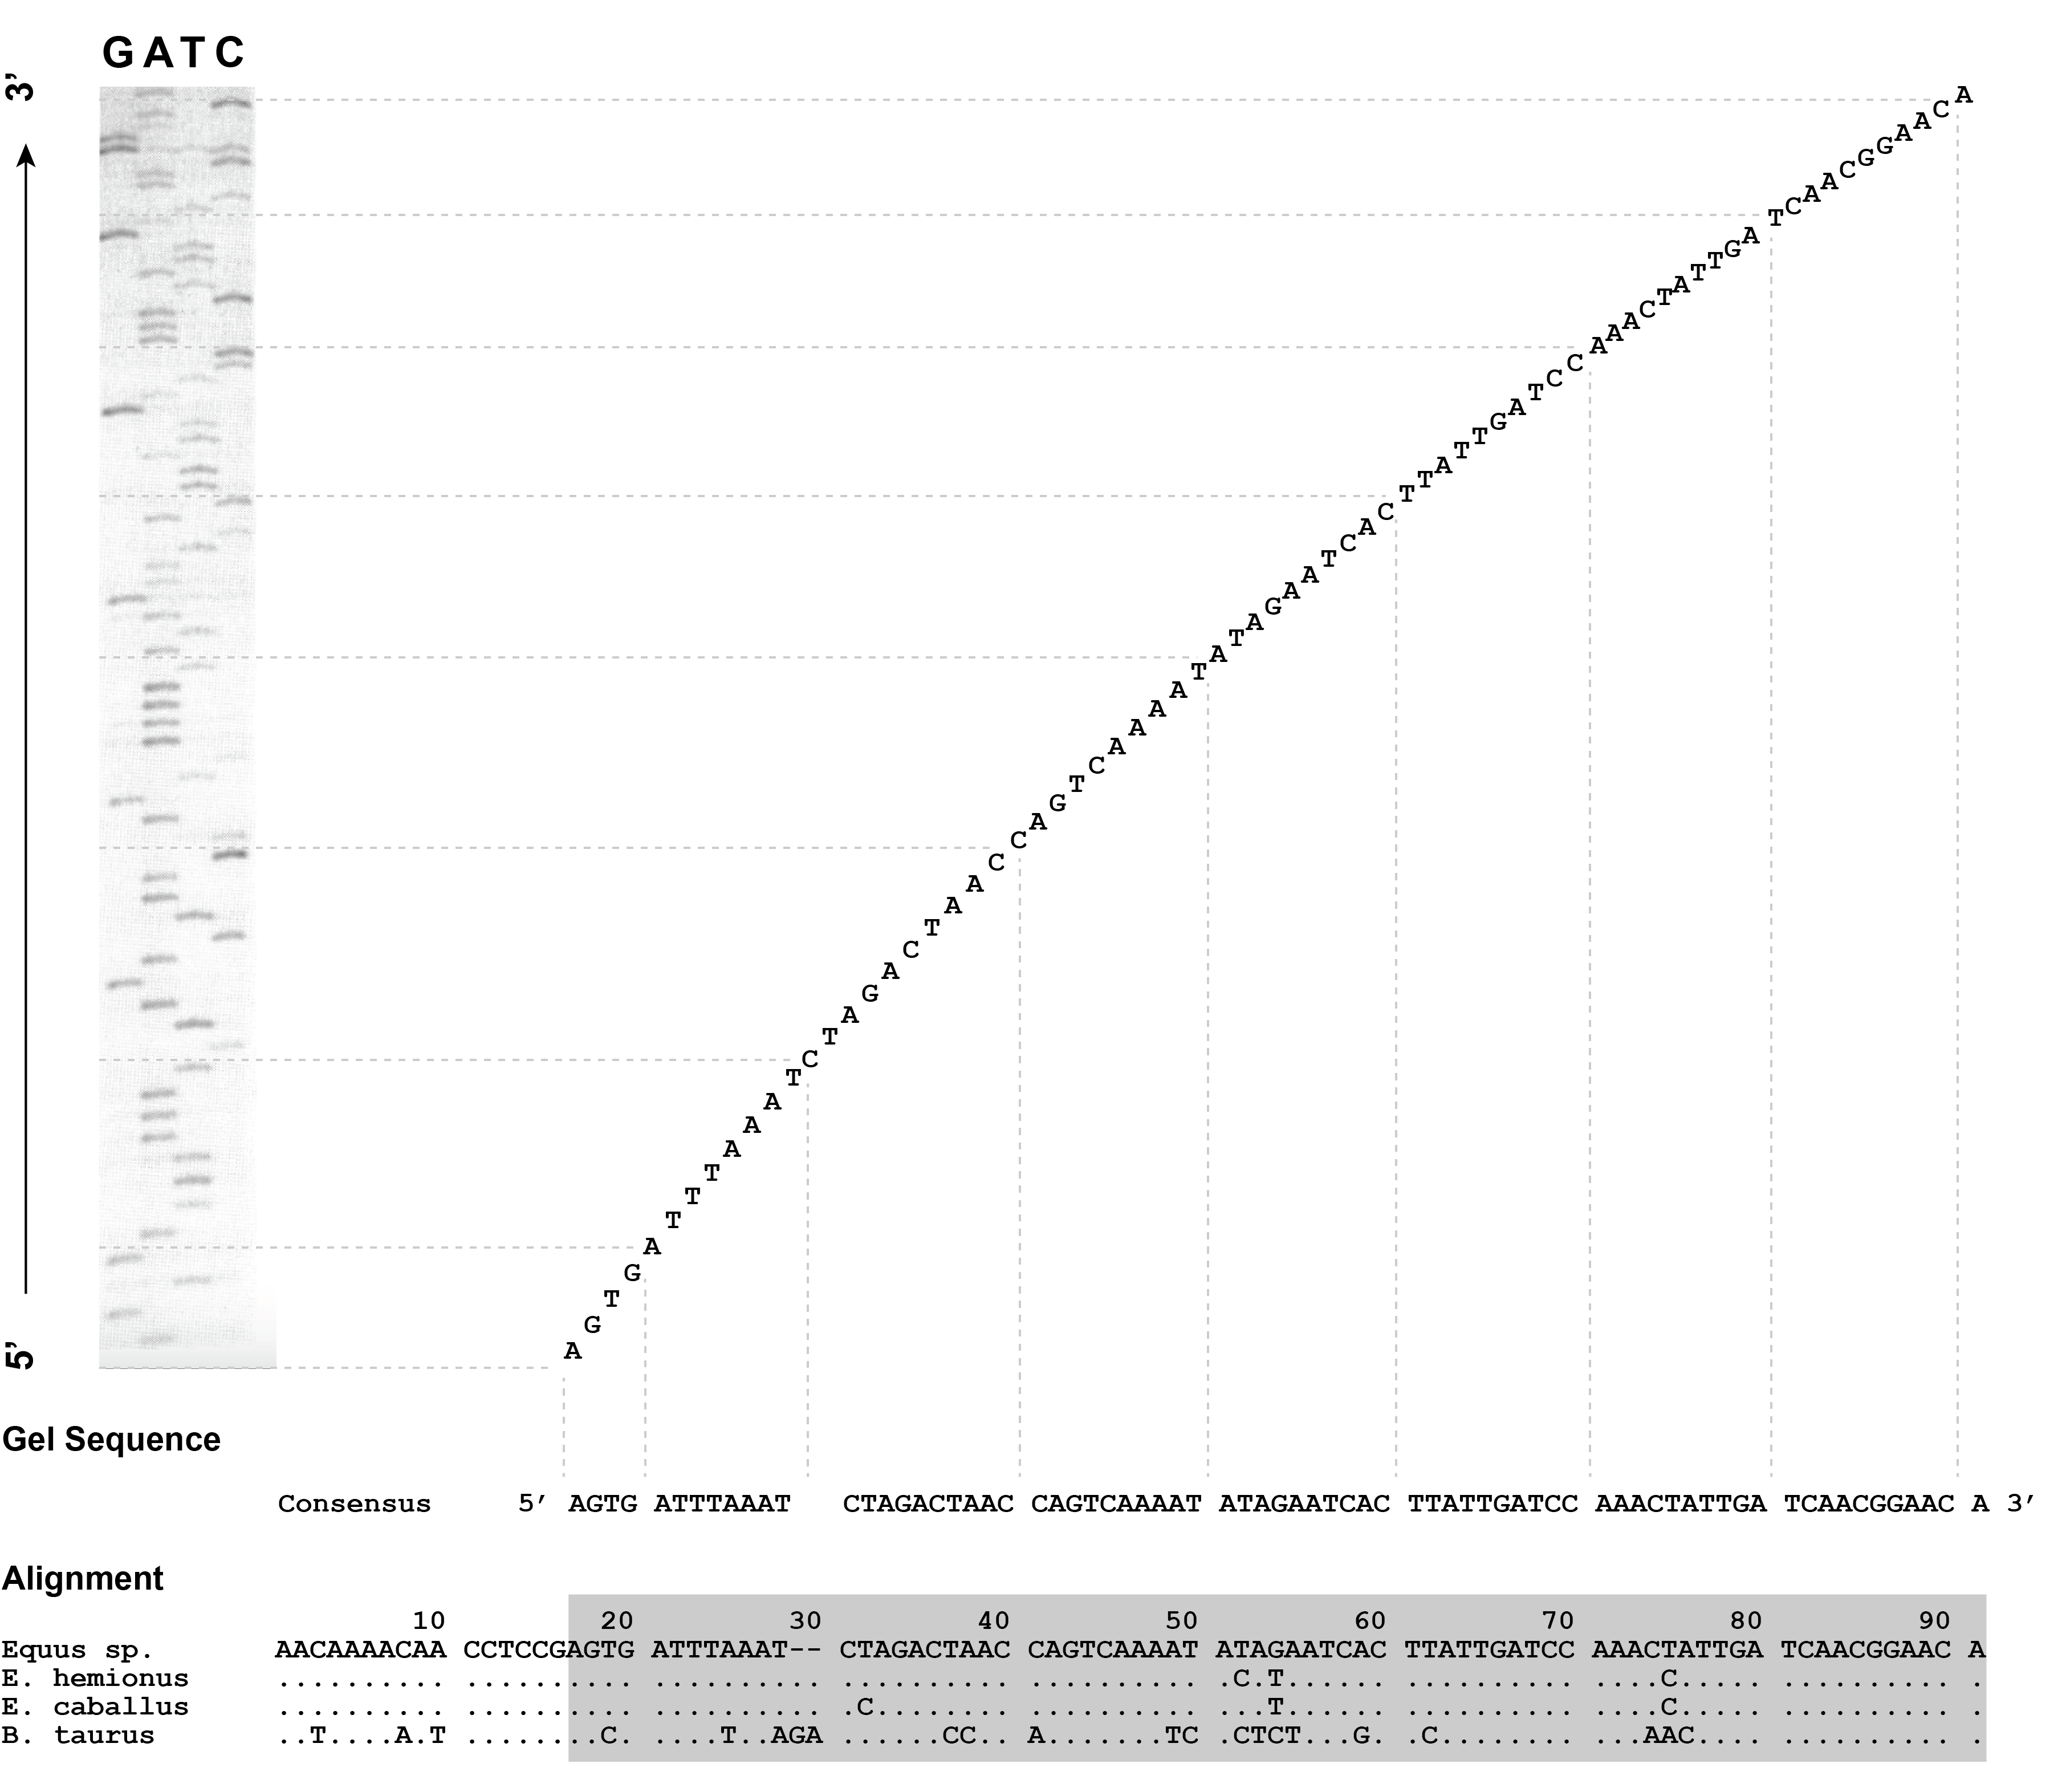
Remarkably, the original quagga sequences were obtained using Sanger Sequencing without the use of polymerase chain reaction (PCR). Although PCR was invented by Kary Mullis in the 1980s (Saiki et al. 1985, 1988), it did not become widely accessible until the early 1990s (Bartlett and Stirling 2003; Mullis et al. 1992). Thus Higuchi and colleagues achieved the first ancient DNA sequences through even more laborious methods based on restriction enzymes and bacterial cloning. In total, their study reports two ancient DNA sequences, one 114 bp long and the other 112 bp long, from one ancient sample. Now contrast this to today, when it is possible to routinely generate >50 billion high quality ancient DNA sequences every 48 hours on an Illumina NovaSeq X instrument (https://emea.illumina.com/systems/sequencing-platforms/novaseq-x-plus.html).
Ancient DNA sequencing has come a long way since the 1980s, and grappling with these changes is the rationale for developing this textbook and companion course on Ancient Metagenomics, which focuses on bioinformatic coding and scripting. During the Sanger sequencing era, from the 1980s to the 2000s, the vast majority of the hours of work that went into ancient DNA analysis was in the laboratory and consisted of extensive wet lab preparation of samples to reach the point where a relatively short DNA sequence could be generated. It is no wonder then that this era demanded intensive training in biochemistry and molecular biology. The situation is very different today, in which the laboratory methods have become highly standardised but the data output is enormous. Since the rise of high-throughput sequencing in 2010s, the main challenge for ancient DNA researchers has become how to manage this deluge of genetic data, and this requires specialised computational and bioinformatics skills to be able to handle, process, and interpret the vast amounts of data that make up today’s ancient DNA datasets.
2.2 From quagga to ancient microbes
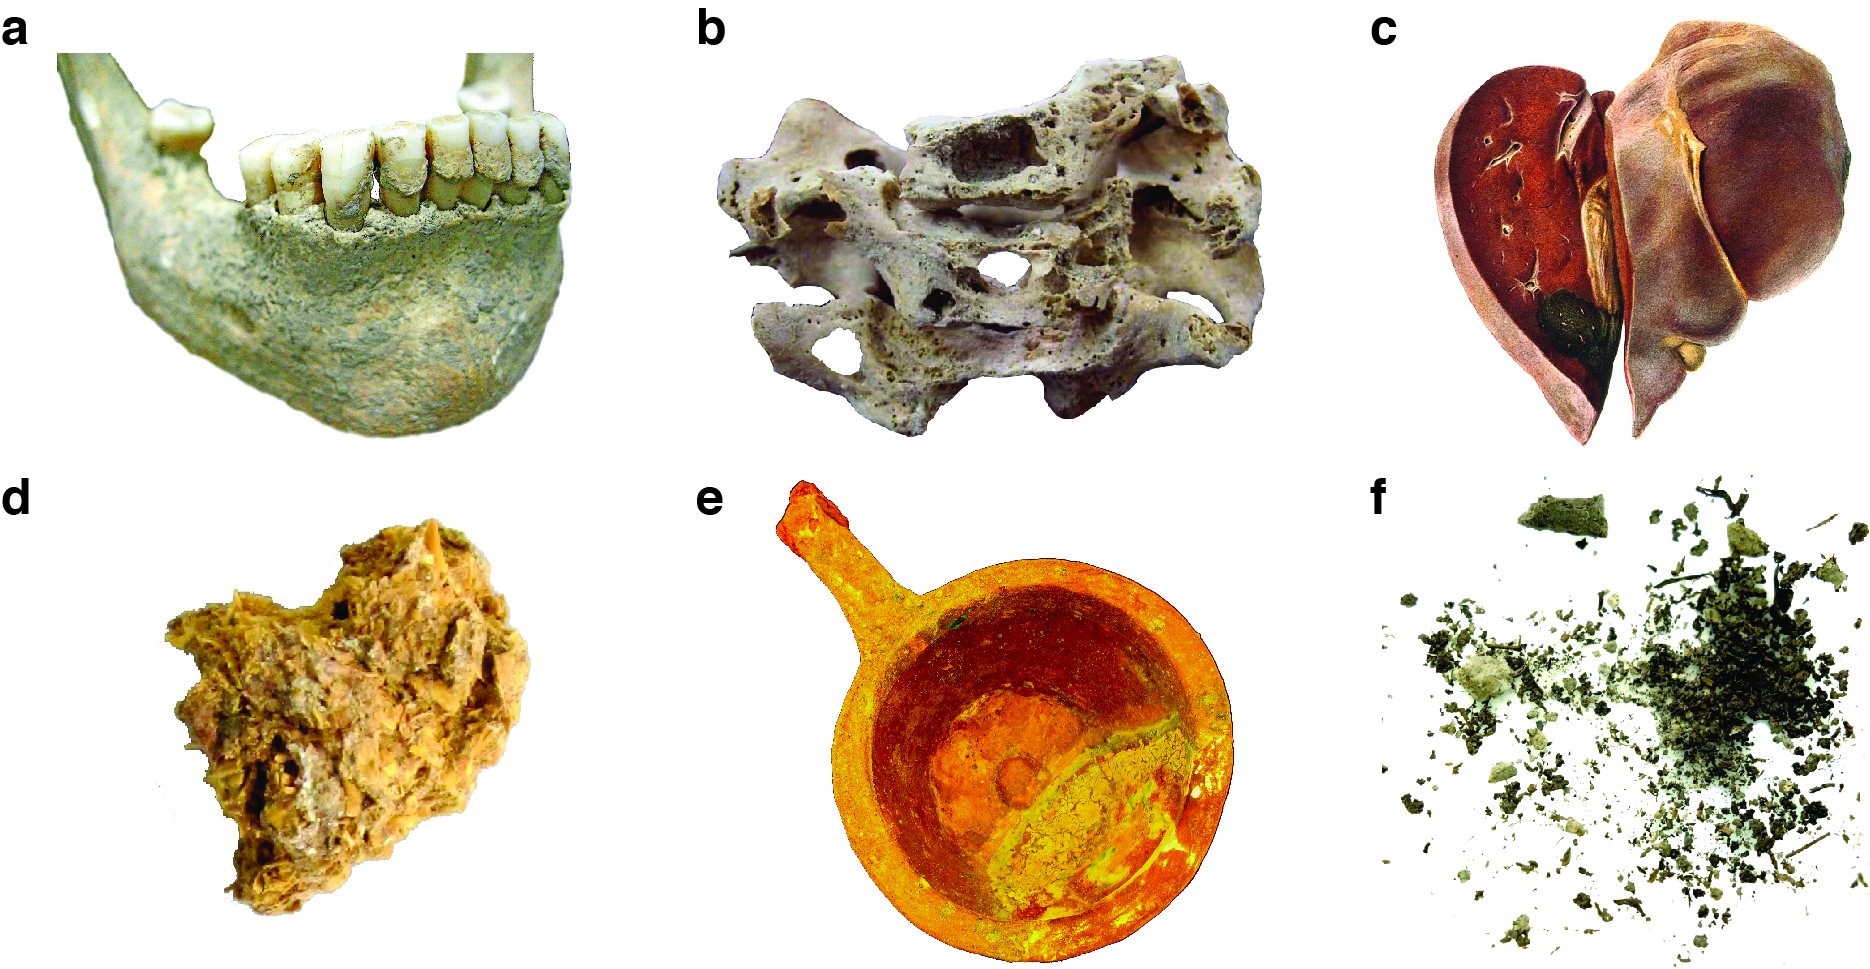
How did we get from quagga to ancient microbes? It has been an incredible journey, made all the more remarkable by the fact that nearly everything we now know about ancient microbes has been achieved through the study of ancient DNA. The rest of this chapter will focus on how genetic technologies are used to study ancient microbes. But first, let’s start with some important questions: Where exactly does one find the DNA of ancient microbes? How does one archaeologically recover organisms that are too small to see? It turns out there are several reliable sources of ancient microbes that have proven to be productive and informative about the past. Here, we will review six sources that are particularly important in archaeology: teeth, bones, historic medical specimens, palaeofaeces, cultural objects, and sediments (Figure 2.3).
2.2.1 Teeth
Perhaps the single greatest source of ancient microbial DNA is teeth. As the only part of the skeleton normally visible during life, teeth are also the only part of the skeleton typically colonised by microbes. Figure 2.3 shows the mandible (lower jaw) of a woman who died around a thousand years ago at the medieval monastic site of Dalheim in Germany (Warinner et al. 2014; Radini et al. 2019). Several important microbially-associated features are visible. First, there are mineral accretions on the surface of her teeth. These accretions are called dental calculus, and they form through the periodic calcification of dental plaque (Fagernäs and Warinner 2023; Warinner, Speller, and Collins 2015). Below the calculus, the alveolar bone (which holds the teeth) is thickened, recessed, and porous - indications that the periodontium (the soft and hard tissues supporting the teeth) was chronically inflamed by dental plaque bacteria during life. Left untreated, this inflammation has caused partial destruction of the alveolar bone, a medical condition known as periodontitis. Thus, even from a simple visual inspection we can already see signs of ancient microbial activity that occurred during this woman’s life.
Figure 2.4 shows a closer view of one of the teeth in cross-section using scanning electron microscopy (SEM). There are three main sources of microbial DNA that can be obtained from this tooth. On the surface of the enamel, which appears as white, the mineral accretions of dental calculus are visible. Within the dental calculus are thousands, if not millions, of individual bacterial cells that were calcified in situ (Figure 2.4, panel A). They are, in a sense, frozen in time, along with their DNA (Fagernäs and Warinner 2023). The process by which dental plaque calcifies into dental calculus happens at regular intervals over an individual’s lifetime, building up a calcified biofilm that can become several millimetres thick. This process occurs during life, and in fact dental calculus is the only part of your body that routinely fossilises while you are still alive. What you see in Figure 2.4 are the calcified remains of the oral microbiome, and specifically the dental plaque bacteria that grow on the surfaces of teeth. Although most bacteria within dental calculus are commensals, respiratory and other pathogens affecting the oral cavity have also been identified within calculus, including Klebsiella pneumoniae (R. M. Austin et al. 2022) and Mycobacterium leprae (Fotakis et al. 2020).
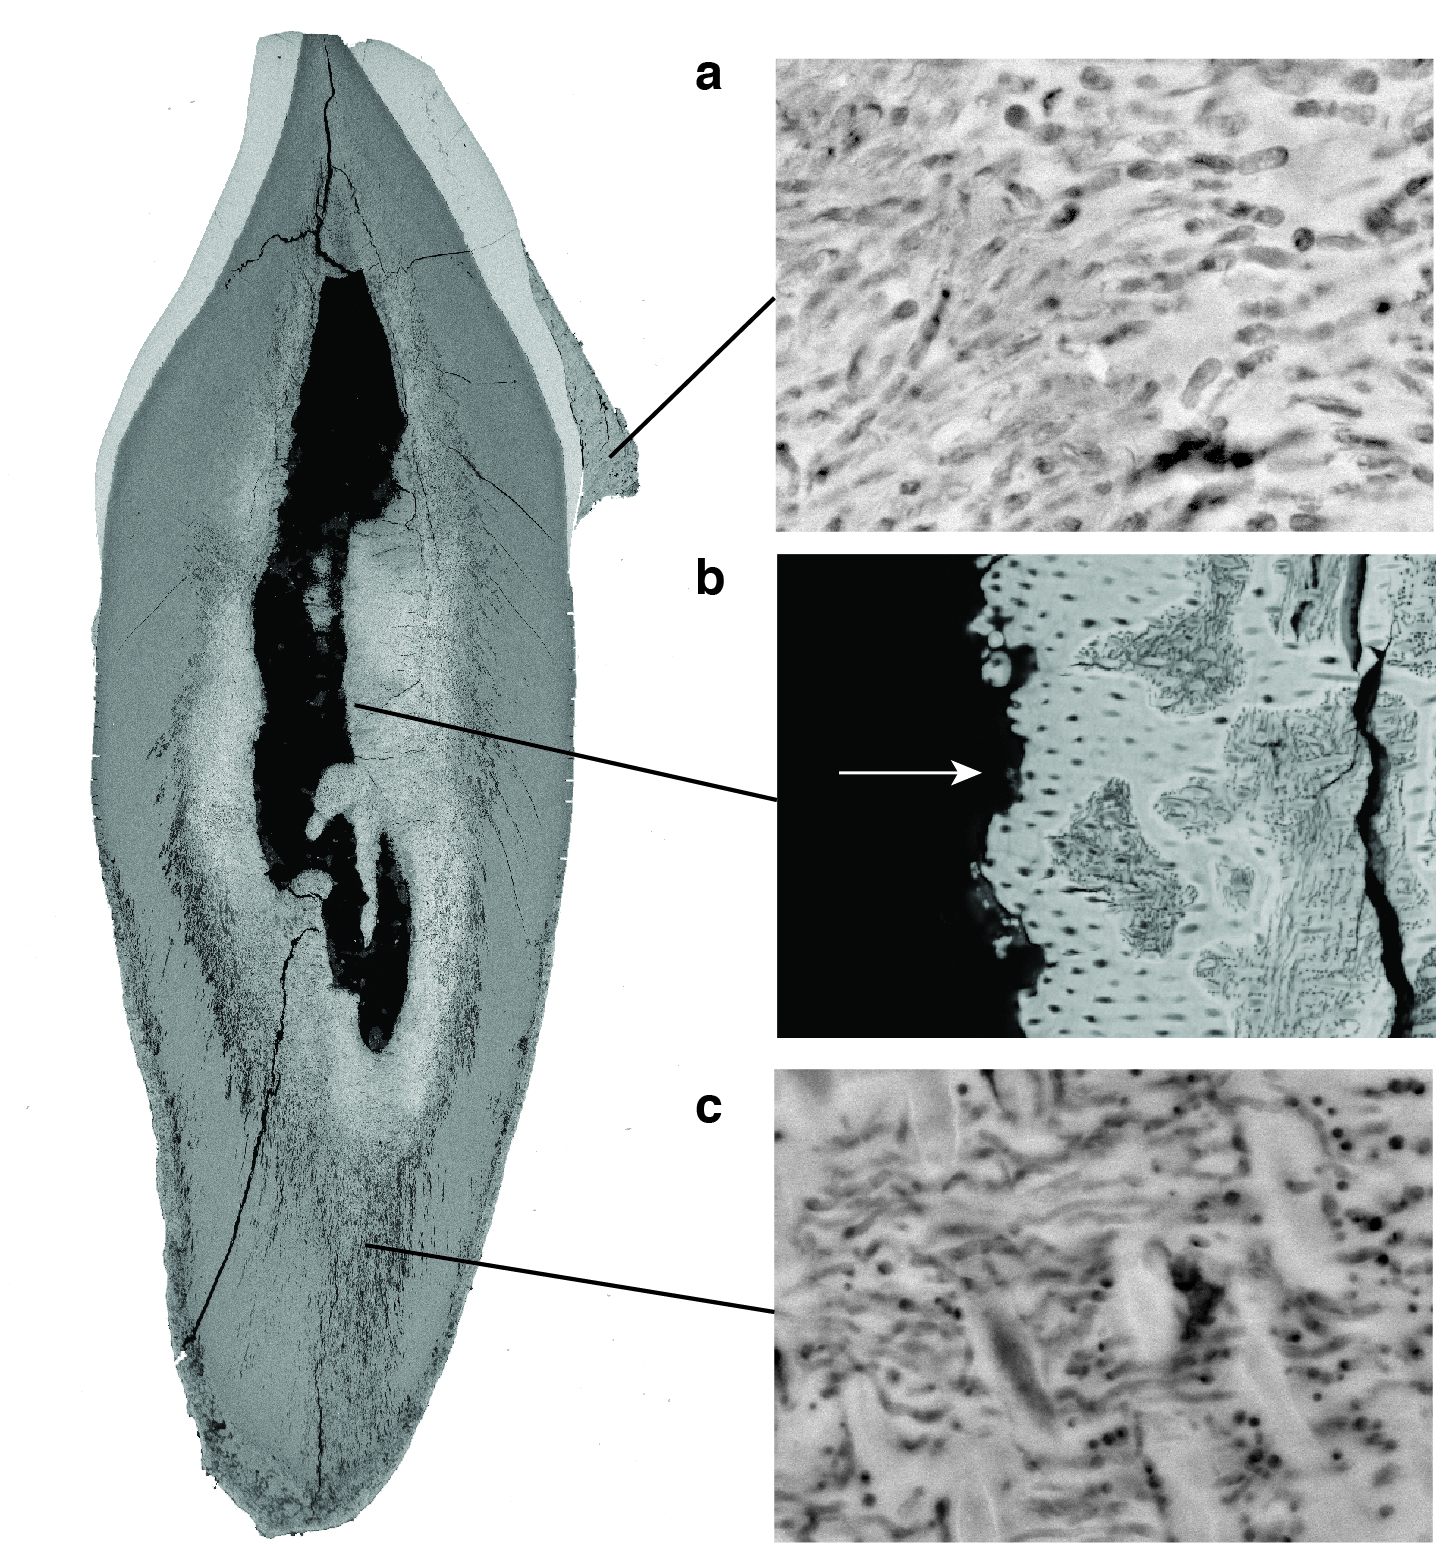
Figure 2.4 (panel B) shows a close-up view of the pulp chamber of the tooth. During life, the pulp chamber of the tooth is vascularised. There are blood vessels that run through the root canal and feed the dental pulp, which is at the center of each tooth. This connects the teeth to the broader circulatory system. During life, if a person has a blood-borne infection, any pathogens that are circulating in the blood will also circulate through the teeth in the dental pulp chamber. If this person dies while the infection is active, the pathogens will remain in the tooth and decay in place, and their DNA will end up becoming smeared along the walls of the dental pulp chamber. The dental pulp chamber is one of the best known sources of DNA from pathogens involved in infectious blood-borne diseases around the time of death (Spyrou et al. 2019). Several pathogens have been identified archaeologically by analysing ancient DNA in the dental pulp chamber, including Yersinia pestis (Bos et al., 2011), Salmonella enterica Paratyphi C (Vågene et al. 2018), smallpox (Mühlemann et al. 2020), and hepatitis B virus (Kocher et al. 2021).
Figure 2.4 (panel C) shows a part of the tooth dentine that is actively undergoing decomposition. This decomposition appears as discolouration in the SEM, and tissue degradation gives the dentine a ragged appearance. Such changes are caused by the activity of the necrobiome, the bacteria that contribute to the decay and decomposition of the teeth. Within the figure, many small dark bacterial cells are visible. They are dark in colour because they are not mineralised, and they are not mineralised because they are alive. These are the many living bacteria that are slowly breaking down and decomposing the tooth. Most necrobiome bacteria are environmental bacteria that originate from the burial sediments (Warinner et al. 2014), but in some cases oral bacteria can also contribute to decomposition (Mann et al. 2018). One thing that is important to keep in mind about the necrobiome is that these bacteria can also be quite old. Bacteria invade the body and start to break it down within hours or days of death. When these bacteria die, their DNA will also accumulate damage and appear ancient. When analysing the necrobiome, it is typical to observe a mixture of DNA from bacteria of different ages. Some of the necrobiome DNA will originate from dead bacteria that contributed to the early stages of decomposition, and these dead bacteria may be nearly as old as the tooth itself and will show signs of DNA damage. Other necrobiome DNA will originate from living bacteria, including those that have more recently colonised the tooth.
2.2.2 Bone
Bone, and especially pathological bone, is another important source of ancient microbial DNA (Figure 2.3, panel B). Some diseases that infect the skeleton, especially those that are chronic and progress over many months or years, may cause lesions or other characteristic alterations in bone. Chronic pulmonary infections, such as tuberculosis, can escape the lungs and infect neighbouring tissues, forming lesions on the interior of the ribs or infecting the thoracic vertebrae. Invasion of the vertebrae by the bacterial pathogen Mycobacterium tuberculosis can cause large lesions and cavities to form within the vertebral bodies (Figure 2.3, panel B), which weakens and destabilises the spine. This can then result in the vertebrae collapsing forward, a condition called kyphosis. Kyphosis is responsible for the characteristic hunching of the back that accompanies advanced spinal tuberculosis, and it is depicted in a wide range of ancient art. Examples of spinal tuberculosis causing kyphosis have been described at the Chiribaya sites along the southern coast of Peru dating to ca. 1000 ya (Bos et al. 2014). Leprosy is another disease that produces characteristic alterations to the skeleton. Leprosy is caused by Mycobacterium leprae, and as the disease progresses it results in a widening of the nasal aperture, destruction of the bone around the maxillary dentition, and the destruction and loss of bones in the extremities, especially fingers and toes. These features can be recognised osteologically in the archaeological record and have led to the recovery of M. leprae DNA from skeletons across Eurasia (Schuenemann et al. 2018).
2.2.3 Historic medical specimens
Historic medical specimens represent a large and varied source of ancient microbial DNA (Figure 2.3, panel C). During the 18th, 19th, and early 20th centuries, many hospitals and medical schools amassed large collections of pathological specimens, which range from biopsies to complete organs. Such specimens were typically preserved and stored in alcohol or formalin, although precise documentation of their treatment is often lacking. Specimens from the early and mid-20th century also include histology slides and tissue blocks, often formalin-fixed and paraffin embedded (FFPE). RNA and DNA can be recovered from such specimens, although success rates are often low due to DNA cross-linking caused by the formalin treatment (Gryseels et al. 2020; Stiller et al. 2016). Investigation of historic medical specimens, such as vaccination kits, have led to important discoveries regarding the diversity of vaccinia virus and orthopoxvirus strains used in 19th century smallpox vaccination efforts (Duggan et al. 2020), and the study of ancient RNA in FFPE tissue blocks has shown that HIV was locally circulating in Central Africa prior to 1960, more than two decades before its global outbreak (Gryseels et al. 2020; Worobey et al. 2008; Zhu et al. 1998).
2.2.4 Palaeofaeces
palaeofaeces are an important source of ancient microbial DNA relating to the gut microbiome and gastrointestinal pathogens (Figure 2.3, panel D). faeces do not preserve in most environments, but specific conditions that immobilise or eliminate water, such as freezing temperatures, extreme dryness, high salinity, or mineralization, can lead to the long-term preservation of archaeological palaeofaeces and coprolites (Shillito et al. 2020). Permafrost, dry caves (Wibowo et al. 2021), and salt mines (Maixner et al. 2021) are among the best environments for the long-term preservation of palaeofaeces. In addition to microbial DNA, palaeofaeces are also a good source of dietary and parasite DNA.
2.2.5 Cultural artifact residues
Residues within cultural artifacts such as serving dishes and food and beverage containers are potential sources of ancient culinary bacteria (Figure 2.3, panel E). For example, food residues from baskets and ceramic bowls in western China have yielded molecular evidence for a variety of yeasts and lactic acid bacteria involved in the making of dairy products (Xie et al. 2016) and sourdough bread (Shevchenko et al. 2014).
2.2.6 Sediments
Finally, archaeological sediments are a rich source of environmental DNA (eDNA) containing the genetic remains of ancient microbes (Figure 2.3, panel F). Sediment samples can be collected through coring, and resin impregnated sediment blocks previously prepared for micromorphology analysis have also been shown to successfully yield ancient DNA (Massilani et al. 2022). The vast majority of research conducted on ancient sediments to date has focused on plant and mammalian DNA in order to reconstruct ancient ecosystems (Linderholm 2021; Capo et al. 2022; Kjær et al. 2022; Zavala et al. 2021). However, interest in characterizing ancient microorganisms, such as plankton, is increasing (Armbrecht 2020), and the analysis of ancient bacteria is within reach (Fernandez-Guerra et al. 2023), although distinguishing between live and dead pools can be challenging (Ellegaard et al. 2020; Wegner et al. 2023).
2.3 Defining ancient DNA
Having defined the main sources of ancient microbial DNA, we might next ask: What makes something ancient? What is “ancient DNA” as opposed to just DNA? What makes it specifically ancient? Ancient DNA can be defined as any DNA from a non-living source that shows evidence of molecular degradation. You will notice this definition does not specify a particular range of time. That is because ancient DNA is not defined by a fixed age, but rather by its condition. For example, 100,000-year-old Neanderthal oral microbiome DNA from dental calculus (Klapper et al. 2023) would obviously qualify as ancient DNA. And so would 5,000-year-old hepatitis B virus DNA from teeth (Kocher et al. 2021), 3,000-year-old gut microbiome DNA from palaeofaeces (Maixner et al. 2021), 600-year-old plague DNA from skeletons (Bos et al. 2014), oral bacteria from 19th century great apes in a museum (Fellows Yates, Velsko, et al. 2021), vaccinia virus DNA from 19th century medical specimens (Duggan et al. 2020), and even leprosy DNA from mid-20th century FFPE tissue blocks (Blevins et al. 2020). These are all examples of ancient DNA because they all show similar types of DNA damage that require special handling to be able to analyse. Essentially, ancient DNA is DNA that has undergone specific forms of degradation and damage.
2.4 Genome basics
Before going further, let’s first take a step back and ask: Why does this matter? Why is ancient DNA defined by its state of preservation rather than its chronological age? DNA degradation matters when considering the diverse composition, organization, size, and copy number of the genomes we are trying to reconstruct and understand. So before moving on, we will now review some genome basics.
First, let’s consider viruses. Viral genomes can be made up of DNA or RNA, and they can be single-stranded, double-stranded, or partially double-stranded. Their genome can consist of a single molecule of nucleic acid or many molecules, and their genomes can be linear or circular. Figure 2.5 shows the seven different types of viral genomes classified within the Baltimore system of viral classification (Koonin, Krupovic, and Agol 2021). The genomes of viruses are very diverse in structure, organization, and composition.
Bacterial genomes are more consistent in their organization (Bobay and Ochman 2017). A bacterial genome typically consists of one long, continuous circle of double-stranded DNA (Figure 2.5), although some bacteria, such as Streptomyces, have linear genomes (Galperin 2007; Hinnebusch and Tilly 1993). A bacterial genome is often referred to as a chromosome, and while this terminology is not universally accepted due to differences in the compaction and staining properties of prokaryotic and eukaryotic genomes, the term chromosome is widely used by large data archives and platforms, including members of the International Nucleotide Database Collaboration (INSDC). In addition to the main genome, bacteria can also have accessory DNA called plasmids, which are typically smaller circles of DNA that can be exchanged with other bacteria.
The genomes of animals, which are eukaryotes, are more complex. Animals have two genomes: a nuclear genome and a mitochondrial genome (Figure 2.5). The nuclear genome is composed of multiple linear strings of double-stranded DNA, which are called chromosomes (after the Greek chroma, meaning colour, which refers to the staining properties of DNA-protein complexes in eukaryotic chromatin). Each chromosome is one very long linear piece of DNA that is tightly coiled around histones and packaged within the cell nucleus. Animal cells are usually diploid, meaning they have two of each chromosome in their nuclear genome. The mitochondrial genome (mitogenome) is made up of circular double-stranded DNA, and multiple mitogenome copies are present in each of the mitochondria, the energy-producing organelles in the cell cytoplasm. Each cell moreover contains many mitochondria, resulting in an average of 1,000-5,000 mitogenomes per animal cell, depending on cell type (Moraes 2001). The reason mitochondria have circular DNA is because they originate from bacteria that entered into other cells at the beginning of the formation of eukaryotes (Dyall, Brown, and Johnson 2004; Martin, Garg, and Zimorski 2015). While they have undergone substantial genome reduction and transfer of genes to the nuclear genome over time, they themselves have retained the circular organization of their DNA within eukaryotic cells for more than a billion years.
Plant cells are similar in many ways to animal cells, but they also contain additional genomes (Figure 2.5). Like animals, plants have a nuclear genome made up of multiple linear strings of double-stranded DNA folded up within their cell nucleus, but unlike animal cells they are often polyploid, meaning that they can have many copies of each chromosome in their nuclear genome - typically two (diploid), four (tetraploid), six (hexaploid), or eight (octoploid). Like animals, plant cells also have a mitochondrial genome that is circular and double-stranded and present in many copies per cell, with the largest number of copies in root cells (Preuten et al. 2010). However, plants also have additional genomes within other organelles, such as chloroplasts. The plant chloroplast genome is double-stranded and partially circular (Arnold J. Bendich 2004). It originates from a photosynthetic cyanobacteria that entered into cells of plant ancestors early in the development of eukaryotes (Dyall, Brown, and Johnson 2004; Martin, Garg, and Zimorski 2015).
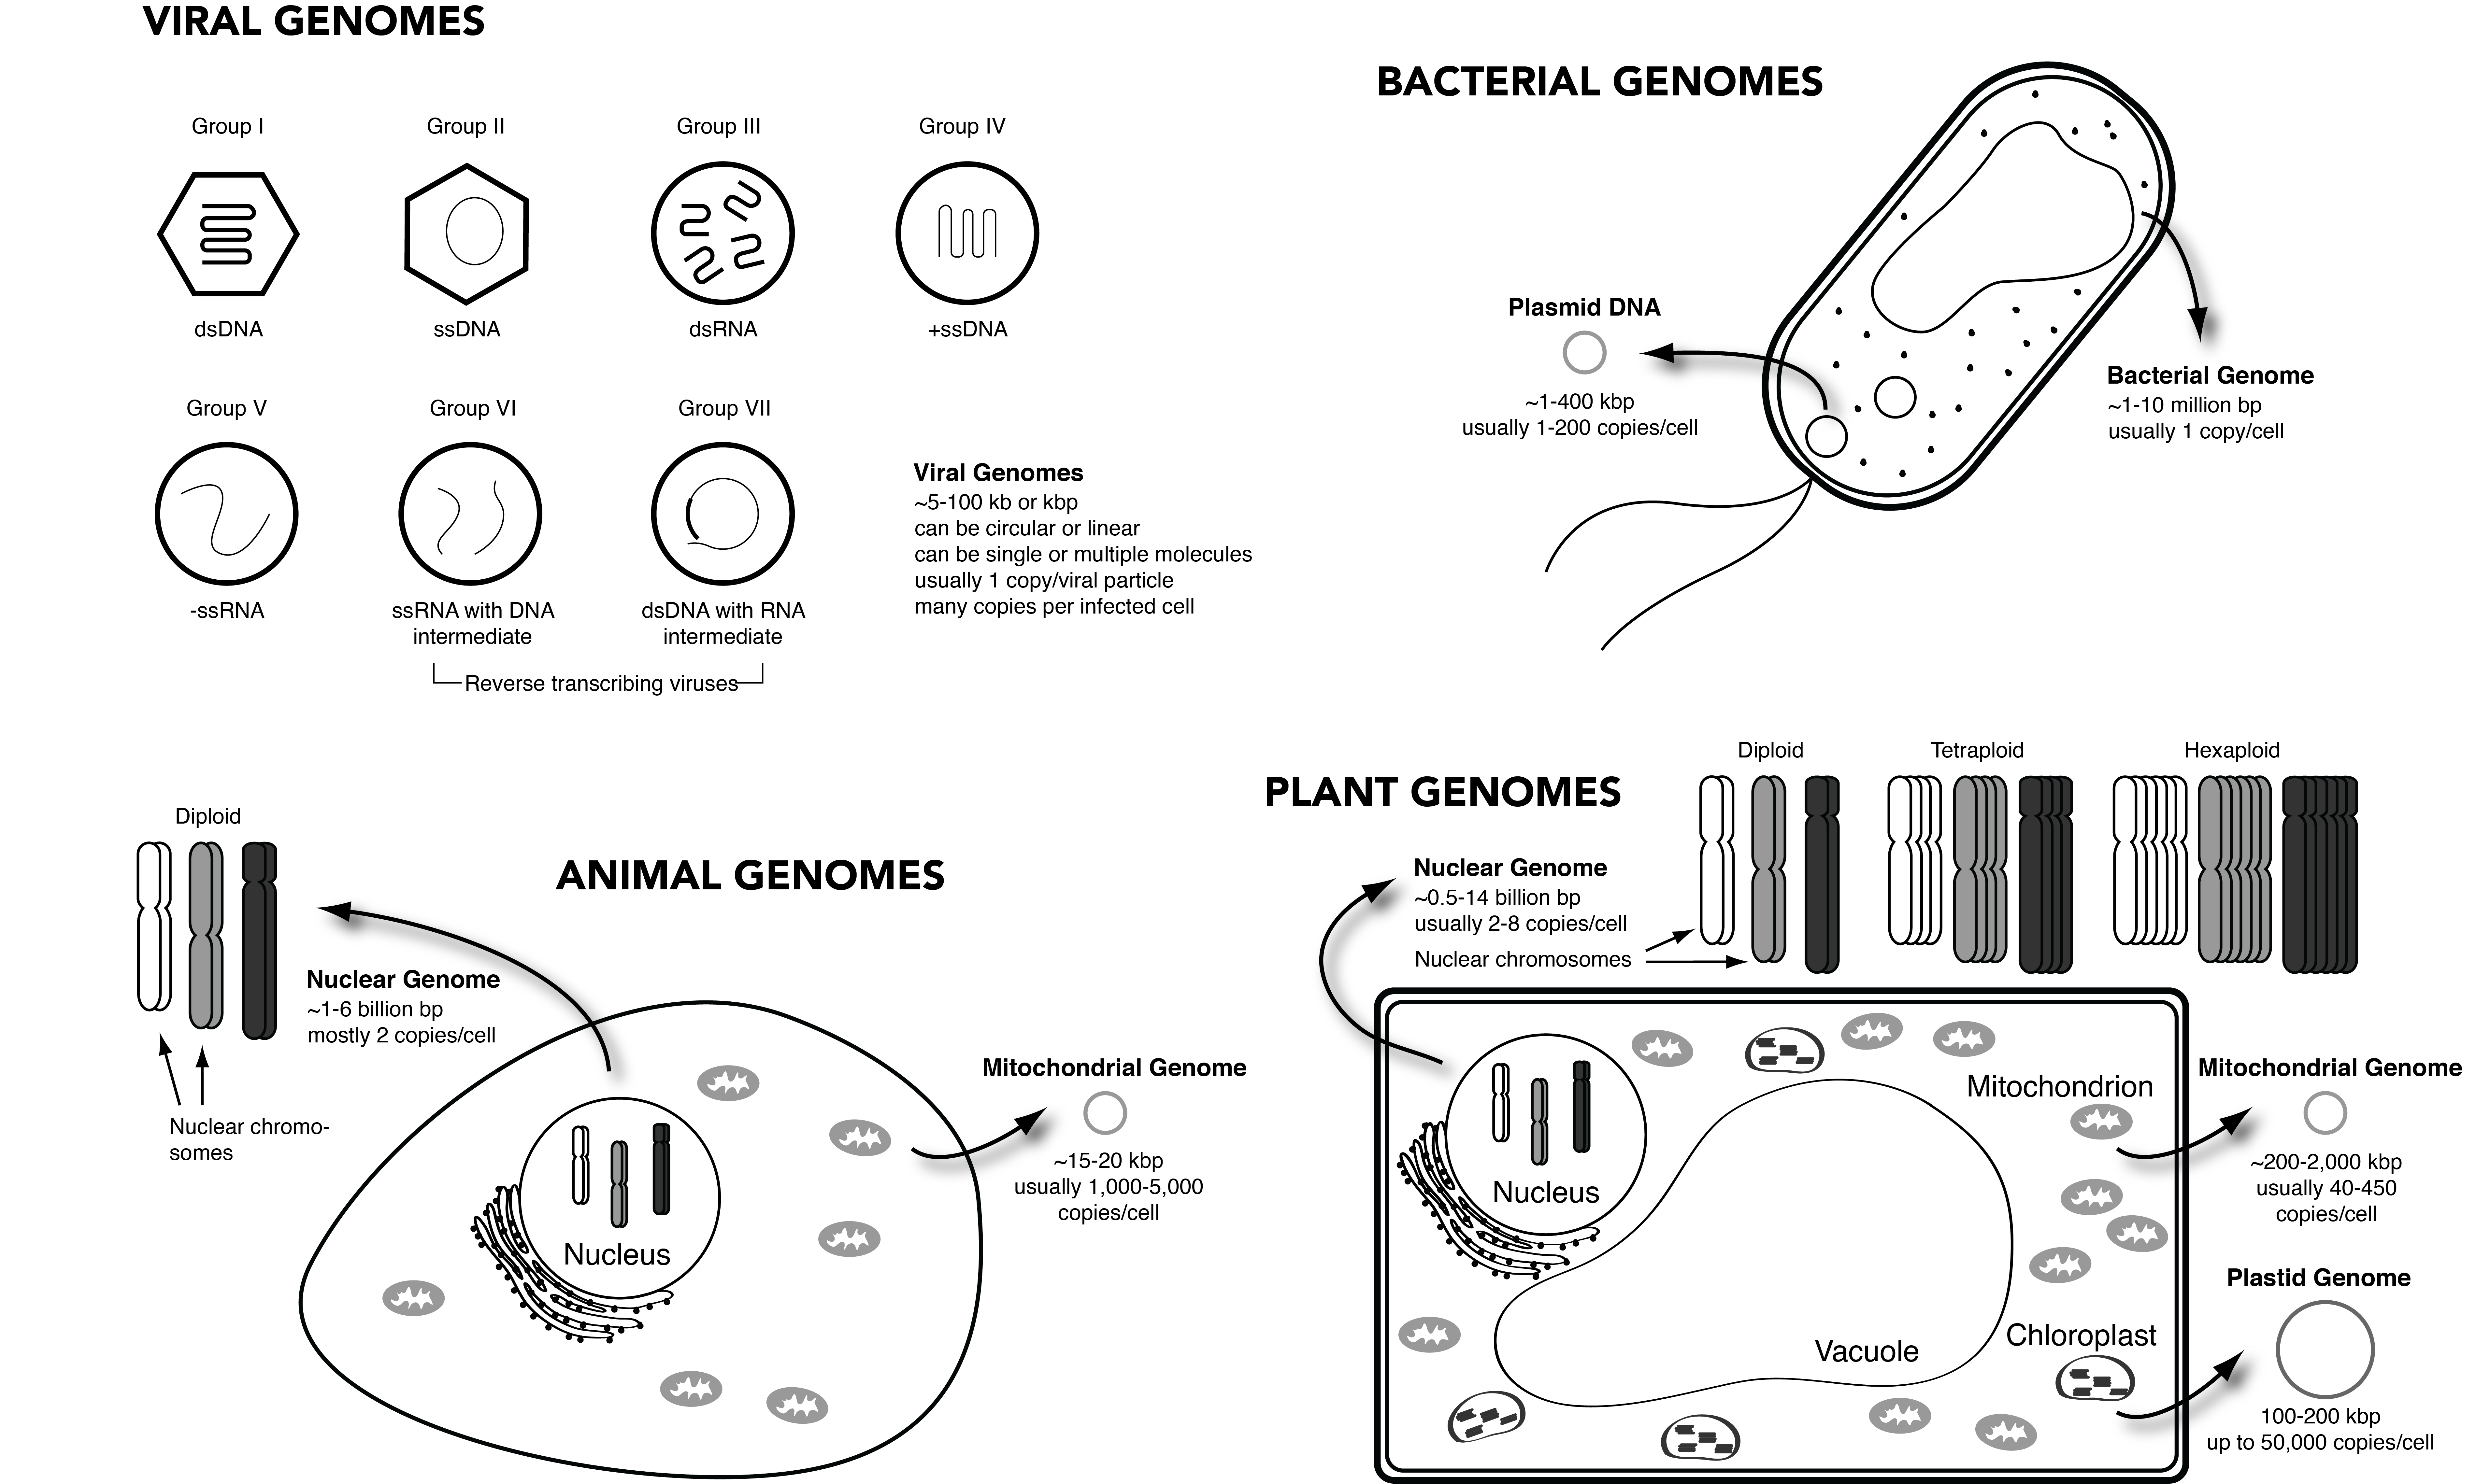
In sum, the term genome is used to refer to a variety of different configurations of nucleic acids within viruses, prokaryotes, and eukaryotes. What are the relative genome sizes of these different types of organisms? Viruses have the smallest genomes, with most viral genomes falling between about 5 and 100 thousand bp long (Campillo-Balderas, Lazcano, and Becerra 2015). Bacteria are bigger. Bacterial genomes are, on average, about 1 to 10 million bp long (Westoby et al. 2021), and their plasmids can vary in size from 1 to 400 thousand bp long (Thomas and Summers 2020). Large plasmids tend to be present in fewer copies than small plasmids, and plasmid copy number is usually 1-200 per bacterial cell (Ilhan et al. 2019; Thomas and Summers 2020). Overall, eukaryotes have the largest genomes, and whereas viral and bacterial genome sizes tend to scale linearly with their number of genes, no such correlation exists in eukaryotes (Bobay and Ochman 2017), a phenomenon that has been described as the C-value paradox or C-value enigma (Gregory 2005). Among animals, birds and mammals generally have nuclear genomes of about 1 to 6 billion bp long (Kapusta, Suh, and Feschotte 2017) and smaller mitogenomes that are 15-20 thousand bp long but present in 1,000-5,000 copies per cell (Boore 1999; Moraes 2001). Plants clock in with an average nuclear genome size of 0.5 to 14 billion base pairs (Michael 2014) and rather large mitogenomes (200 thousand to 2 million bp) and chloroplast genomes (100-200 thousand bp) that are each present in multiple copies per cell (A. J. Bendich 1987; B. R. Green 2011; Morley and Nielsen 2017; Preuten et al. 2010). It is thus clear that genome sizes vary enormously among these different types of organisms, with viruses and microbes typically having much smaller genomes than animals or plants.
Despite these trends, there are nevertheless many genomic outliers that have much larger or smaller genomes than expected. For example, the world’s largest known virus, Pandoravirus salinus, has a genome of 2.5 million bases, which puts it firmly within the typical genome size range of bacteria (Campillo-Balderas, Lazcano, and Becerra 2015). The world’s smallest known bacterial genome, the endosymbiont Carsonella ruddi, is barely larger than a virus at 160 thousand bases long (Nakabachi et al. 2006), while the largest known bacterial genome, Sorangium cellulosum, is 13 million bases long (Schneiker et al. 2007). The largest known animal genome is that of the lungfish Protopterus aethiopicus, at 130 billion bases (Hidalgo et al. 2017). And among plants, the largest known genome is that of a small flowering plant, Paris japonica, at 149 billion bases (Hidalgo et al. 2017). Among eukaryotes, the size of the genome is not related to the complexity of the organism, and currently the organism with the largest known genome is a microscopic single-celled amoeba called Polychaos dubium, with an estimated genome size of 670 billion bases (Parfrey, Lahr, and Katz 2008), although its precise genome size is disputed and difficult to measure (Hidalgo et al. 2017). When trying to reconstruct ancient genomes from short, degraded ancient DNA, the genome size of the target organism matters a lot.
Next, let’s put this information about genome sizes in context. Let’s take the human genome as an example because it is the genome with which we are most familiar. The haploid size, or C-value, of the human genome is approximately 3 gigabase pairs, so 3 billion bp. Our body cells are diploid, so each of our cells contains two copies of the human genome, for a total of 6 billion bp. Humans have 23 chromosome pairs, for a total of 46 chromosomes, and each chromosome ranges in size between 50 and 250 million bp. And recall that chromosomes are really just long linear strings of DNA - very, very, very, very long DNA strings Humans also have a mitogenome, which by comparison is very tiny. It is only about 16,500 bases long, but it is present in thousands of copies per cell. On average, each cell contains 1,000-5,000 mitogenomes, but a mature human egg cell may contain as many as 1.5 million copies of the mitogenome (Cecchino and Garcia-Velasco 2019).
Have you ever wondered how chromosome 1 came to be named chromosome 1, and why chromosome 12 is called chromosome 12? The chromosomes are numbered in order of their length, or at least the length as they were originally calculated using cytogenetics (Figure 2.6). Thus, chromosome 1 is the largest chromosome in the human genome, and it measures nearly 250 million bp long. In contrast, the shortest chromosomes in the human genome, chromosomes 21 and 22, are each around 50 million bp long.
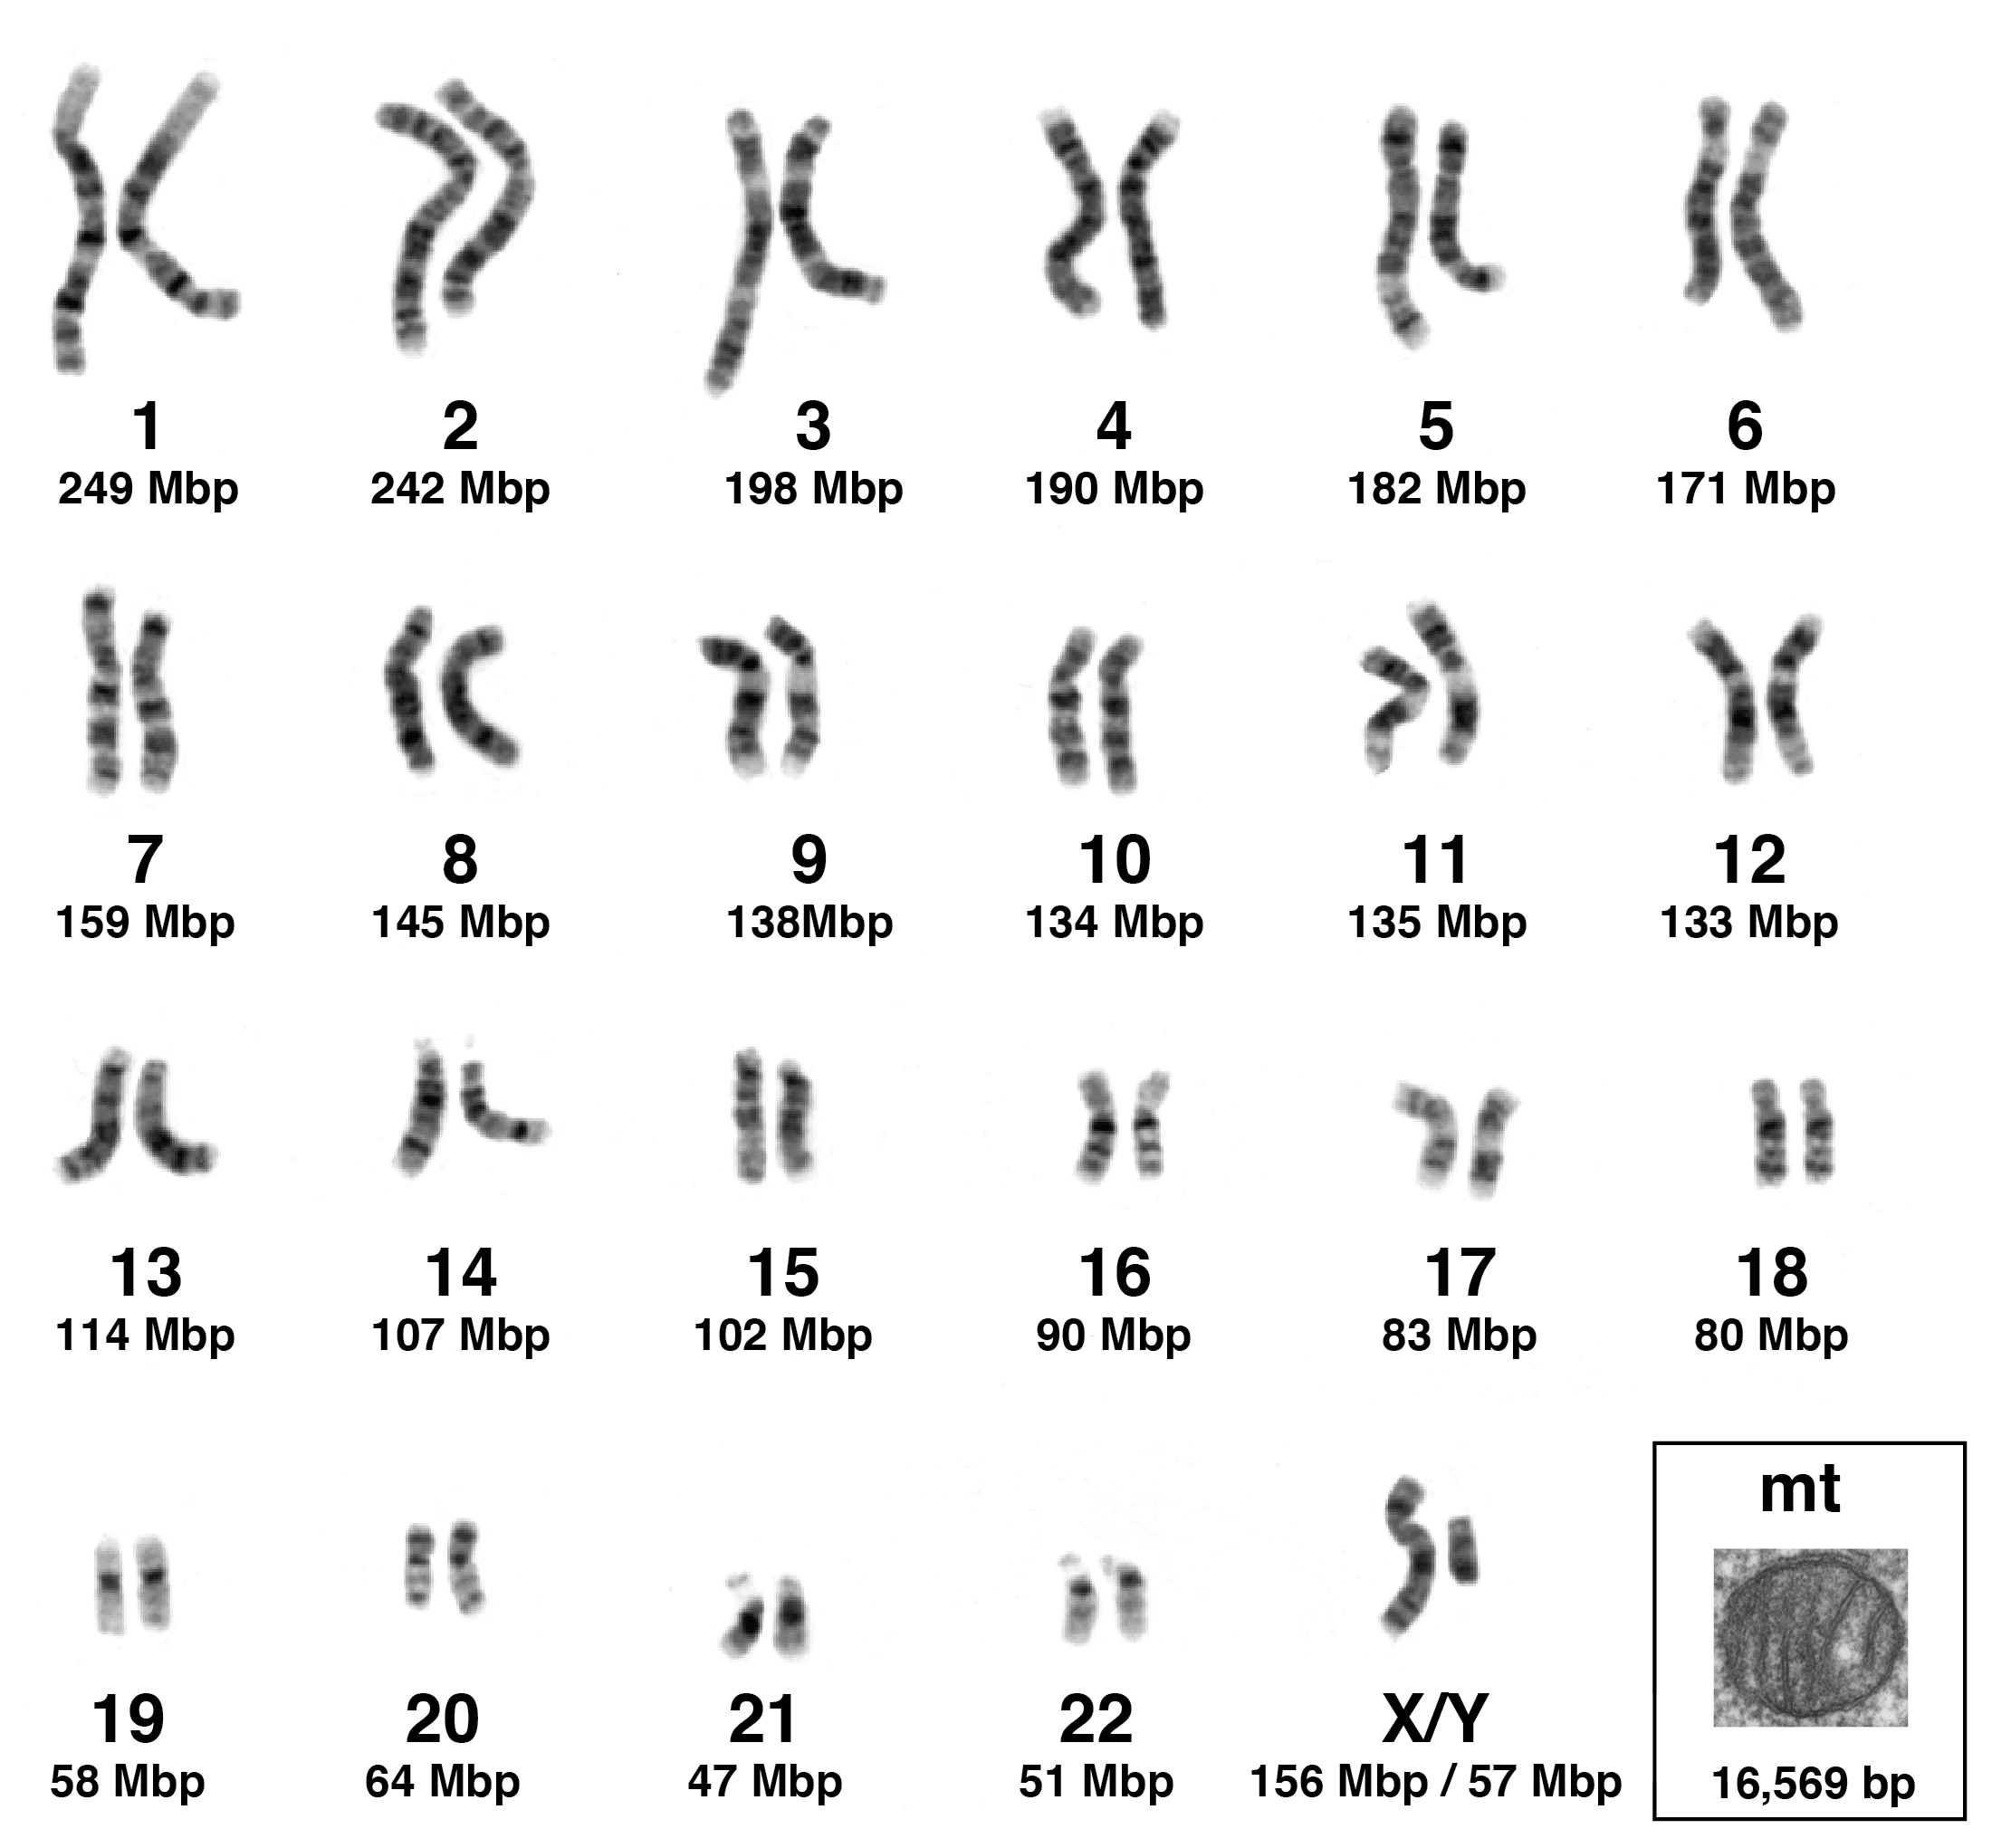
Today, sequencing and analysing high molecular weight genomic DNA from living cells is relatively straightforward, especially with the recent advent of long-read sequences like PacBio and Oxford Nanopore (Koren and Phillippy 2015; Kovaka et al. 2023). However, ancient DNA is very different from the DNA shown in the karyogram in Figure 2.6. Ancient DNA is broken and degraded into thousands, if not millions, of pieces. Let’s take, for example, chromosome 1. In life, it is one continuous string of DNA that is 248,956,422 bp long. After death, it fragments into pieces that are each approximately 50 bp long. So to use a metaphor, I like to refer to ancient DNA as the world’s worst jigsaw puzzle. Because if you had to put together a jigsaw puzzle of chromosome 1 from ancient DNA fragments, it would be a puzzle with over 5 million pieces. Hopefully this puts into perspective the kinds of challenges researchers face when working with ancient DNA.
2.5 How DNA degrades
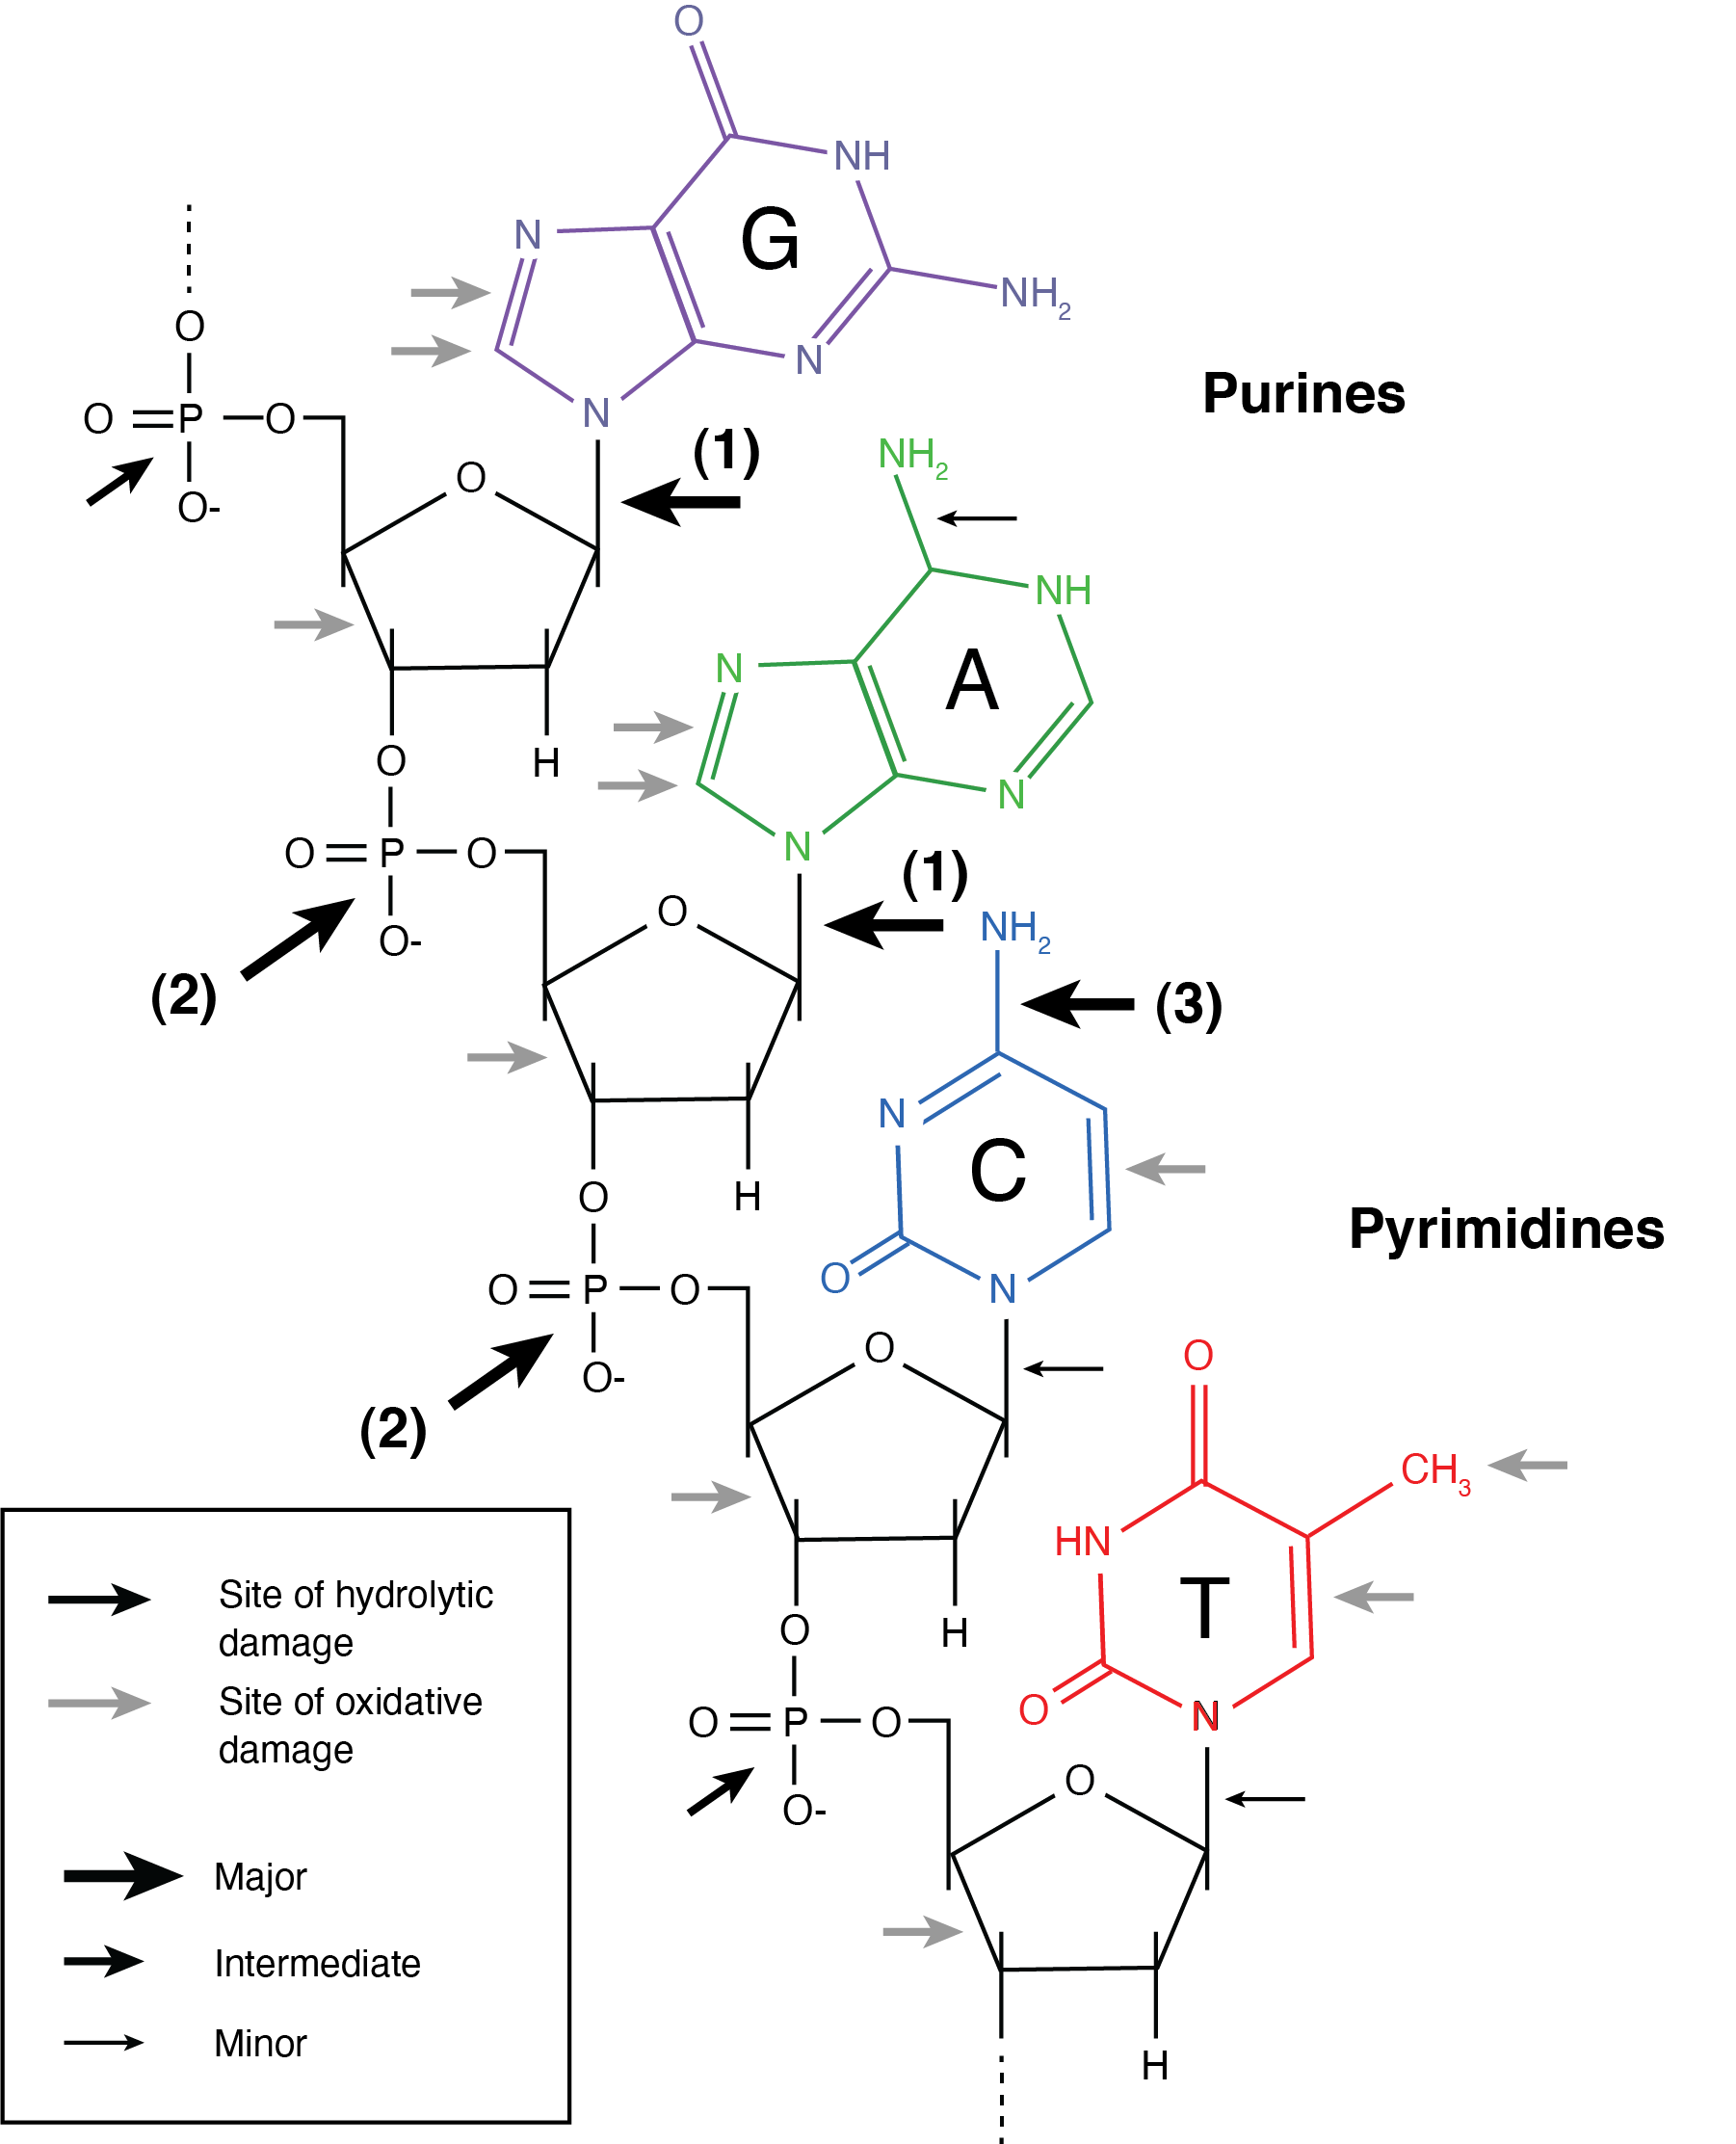
How does DNA degrade? What kind of damage accumulates in ancient DNA over time? Some forms of DNA damage occur during life, for example during disease progression, immune response, and tissue necrosis. Such DNA damage is largely driven by the activity of nucleases, which create a variety of double-stranded breaks (Bokelmann, Glocke, and Meyer 2020; Vladimir V. Didenko 2008; Vladimir V. Didenko, Ngo, and Baskin 2003; V. V. Didenko and Hornsby 1996; Harkins et al. 2020). Other forms of DNA damage occur after death and are largely driven by chemical changes. In 1993, Tomas Lindahl was the first to examine the latter forms of postmortem damage in detail (Lindahl 1993). Lindahl presented a theoretical model of DNA degradation based on the chemical properties of DNA and identified hydrolytic and oxidative decomposition as the most likely types of damage to accumulate in fossil DNA. He also predicted that conditions of high ionic strength, adsorption to hydroxyapatite, and partial dehydration may contribute to long-term DNA preservation. Michael Hofreiter and colleagues expanded Lindahl’s model of ancient DNA degradation in an influential review article in 2001, noting that the empirically observed excess of C->T an G->A miscoding lesions in PCR-amplified ancient DNA likely results from deamination of cytosine residues in ancient DNA template molecules (Hofreiter et al. 2001).
The chemical bonds within DNA that are most vulnerable to degradation are indicated with arrows in Figure 2.7. Although DNA is vulnerable in many places, subsequent research has shown that some of these bonds undergo much faster rates of degradation than others, and that DNA damage generally proceeds in a predictable sequence.
2.5.1 Depurination and nicking
The first step in DNA degradation is typically a hydrolytic attack of the bond attaching the nitrogenous base of purines to the nucleotide’s deoxyribose sugar, a process called depurination (Figure 2.8). Guanines and adenines are purines, so this step leads to the removal of G and A bases, producing abasic sites along the DNA molecule. These abasic sites act like holes along the DNA molecule, and they make the phosphate backbone more exposed and therefore susceptible to attack.
Cleavage of the phosphate backbone occurs next, and this typically occurs 3’ to the abasic site (Figure 2.8). This process is called nicking. These nicks occur randomly along the DNA wherever there are abasic sites. Because they only affect one strand at any given position, they are called single-stranded nicks. As nicks accumulate along the DNA molecule, the DNA becomes destabilised and the hydrogen bonds between the complementary bases become the primary force holding the DNA together. If two nicks form close to each other, the hydrogen bonds between the nicks may not be strong enough to hold the DNA together and the double helix may separate, a process known as melting. Melting occurs when the vibrational energy of the two DNA strands exceeds that of the hydrogen bonds holding them together. Because two nicks rarely form at the same position on the two DNA strands, most nicking results in DNA fragments with single-stranded DNA overhangs (Figure 2.8).
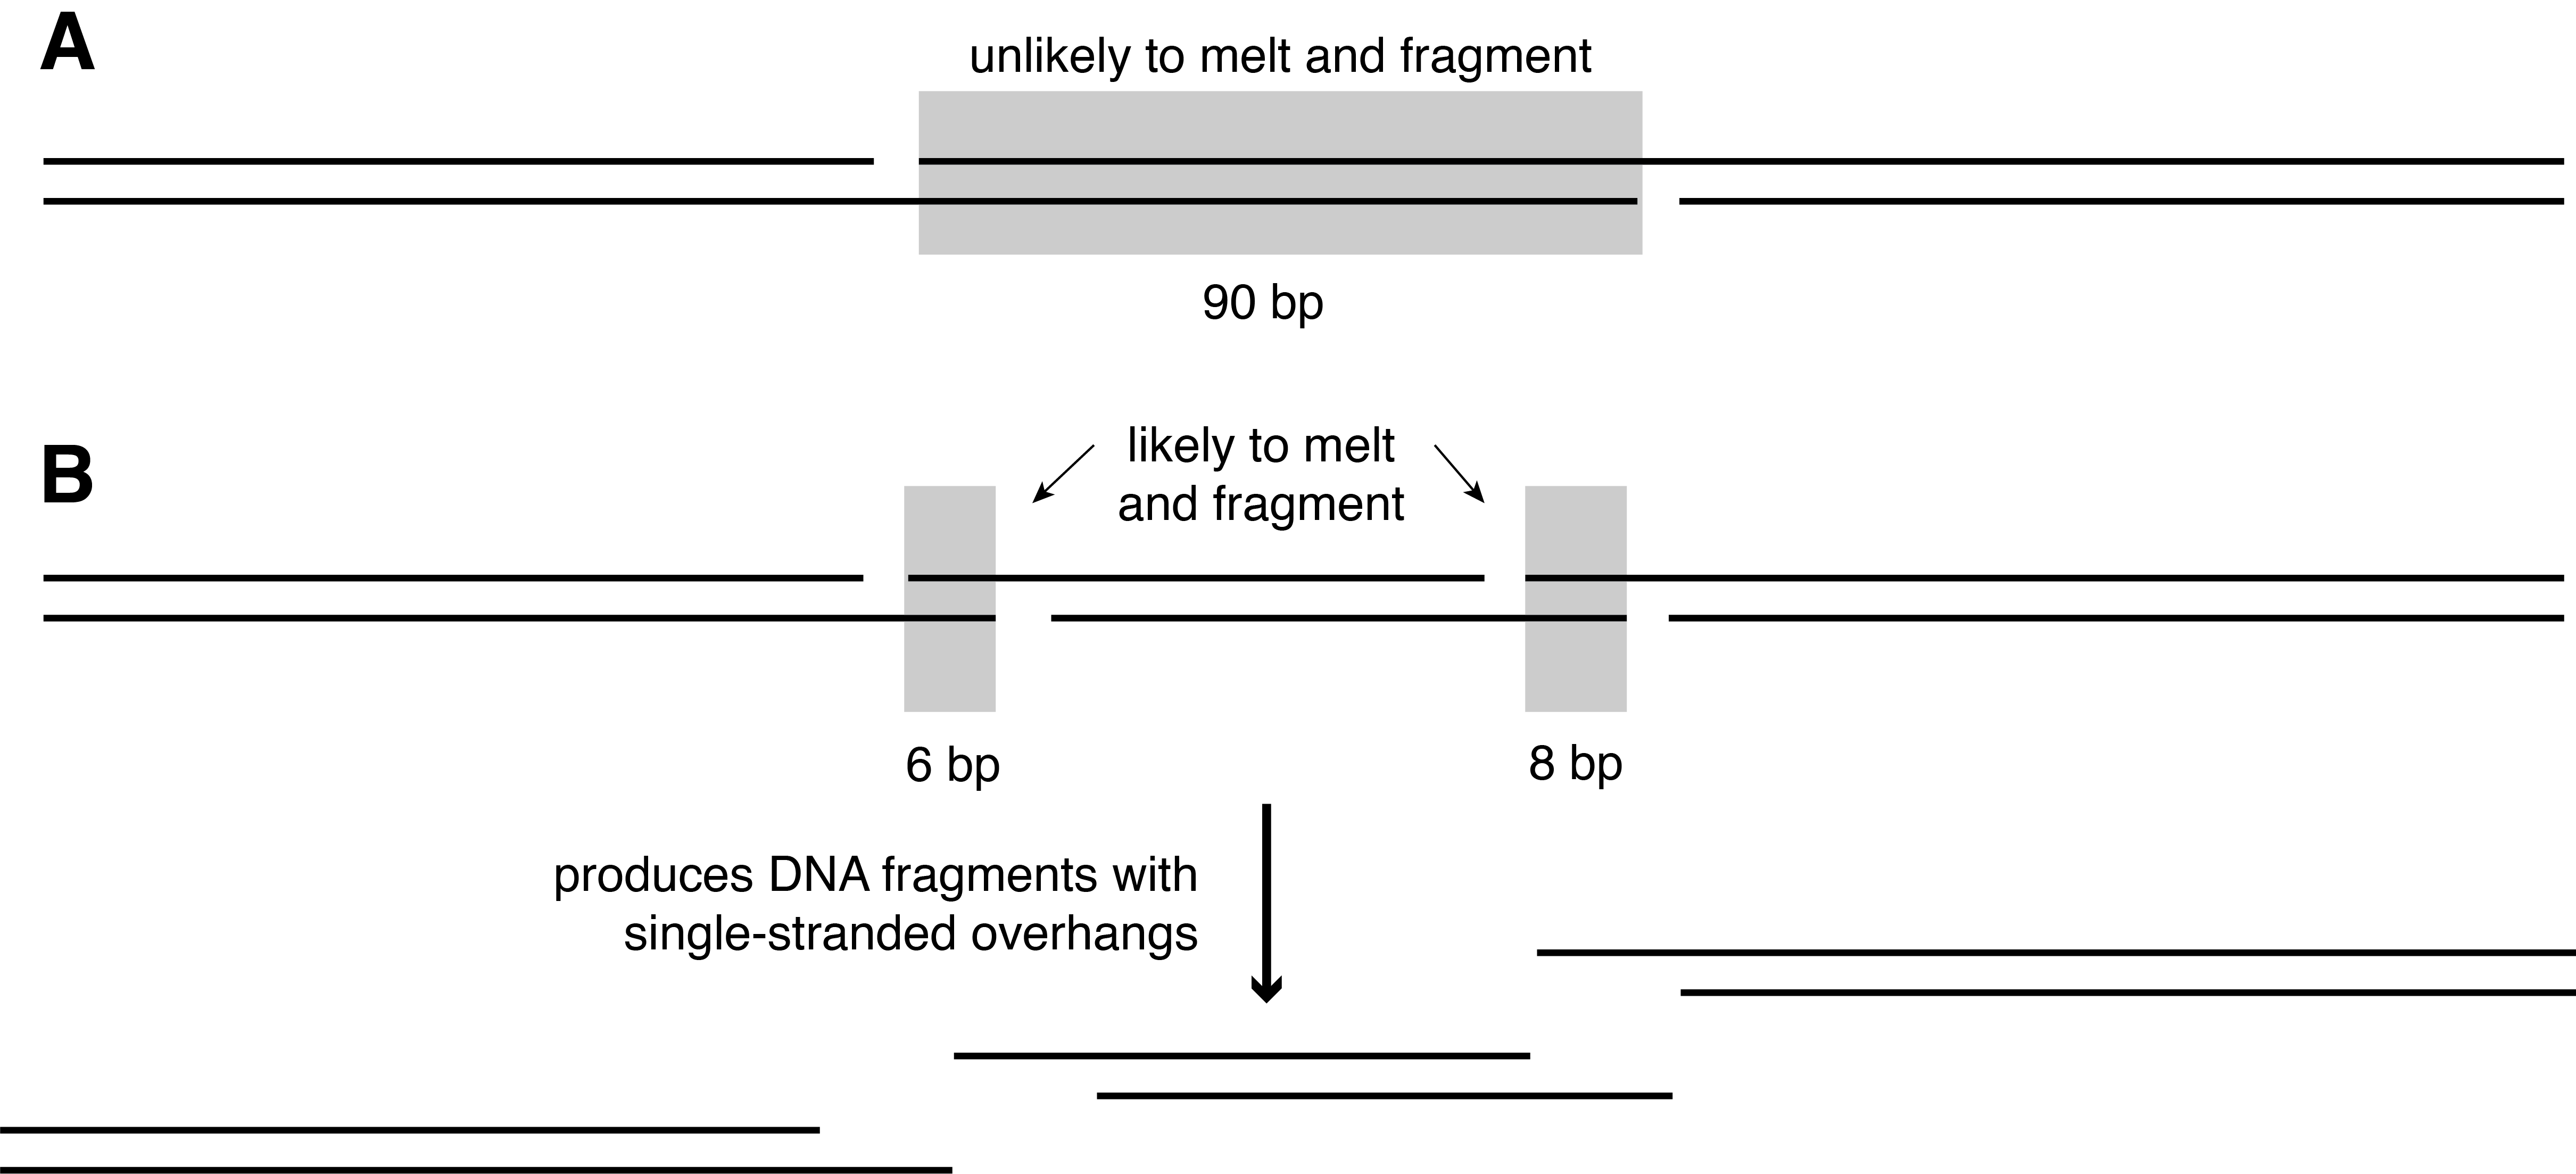
DNA has different local melting points depending on its composition. G and C form a triple hydrogen bond, while A and T form a double hydrogen bond. Consequently, the melting point of GC rich sequences is higher than AT rich sequences. For example, at neutral pH a 12 bp fragment of DNA with the sequence 5’-GCGCGCGCGCGC-3’ will have a melting point of 63.9˚C, while a 12 bp fragment of DNA with the sequence 5’-ATATATATATAT-3’ will have a melting point of 7.8˚C1. Thus, if two single stranded nicks form within 12 bp of each other on opposite strands of the double helix, the DNA is likely to melt and fragment if the DNA is locally AT rich. When nicks are even closer together, the temperature required to melt the strands is even lower. For example, a 6 bp fragment of DNA with the sequence 5’-GCGCGC-3’ will have a melting point of 24˚C, while a 6 bp fragment of DNA with the sequence 5’-ATATAT -3’ will have a melting point of 0˚C. Changes in pH and ion concentration can affect the precise melting temperature, but closely spaced nicks are the major cause of ancient DNA fragmentation at ambient temperatures. Empirically, most ancient DNA overhangs have been found to be very short, with one- and two-nucleotide overhangs being most common, but overhangs can also extend 20 or more nucleotides into the ancient DNA molecule (Bokelmann, Glocke, and Meyer 2020).
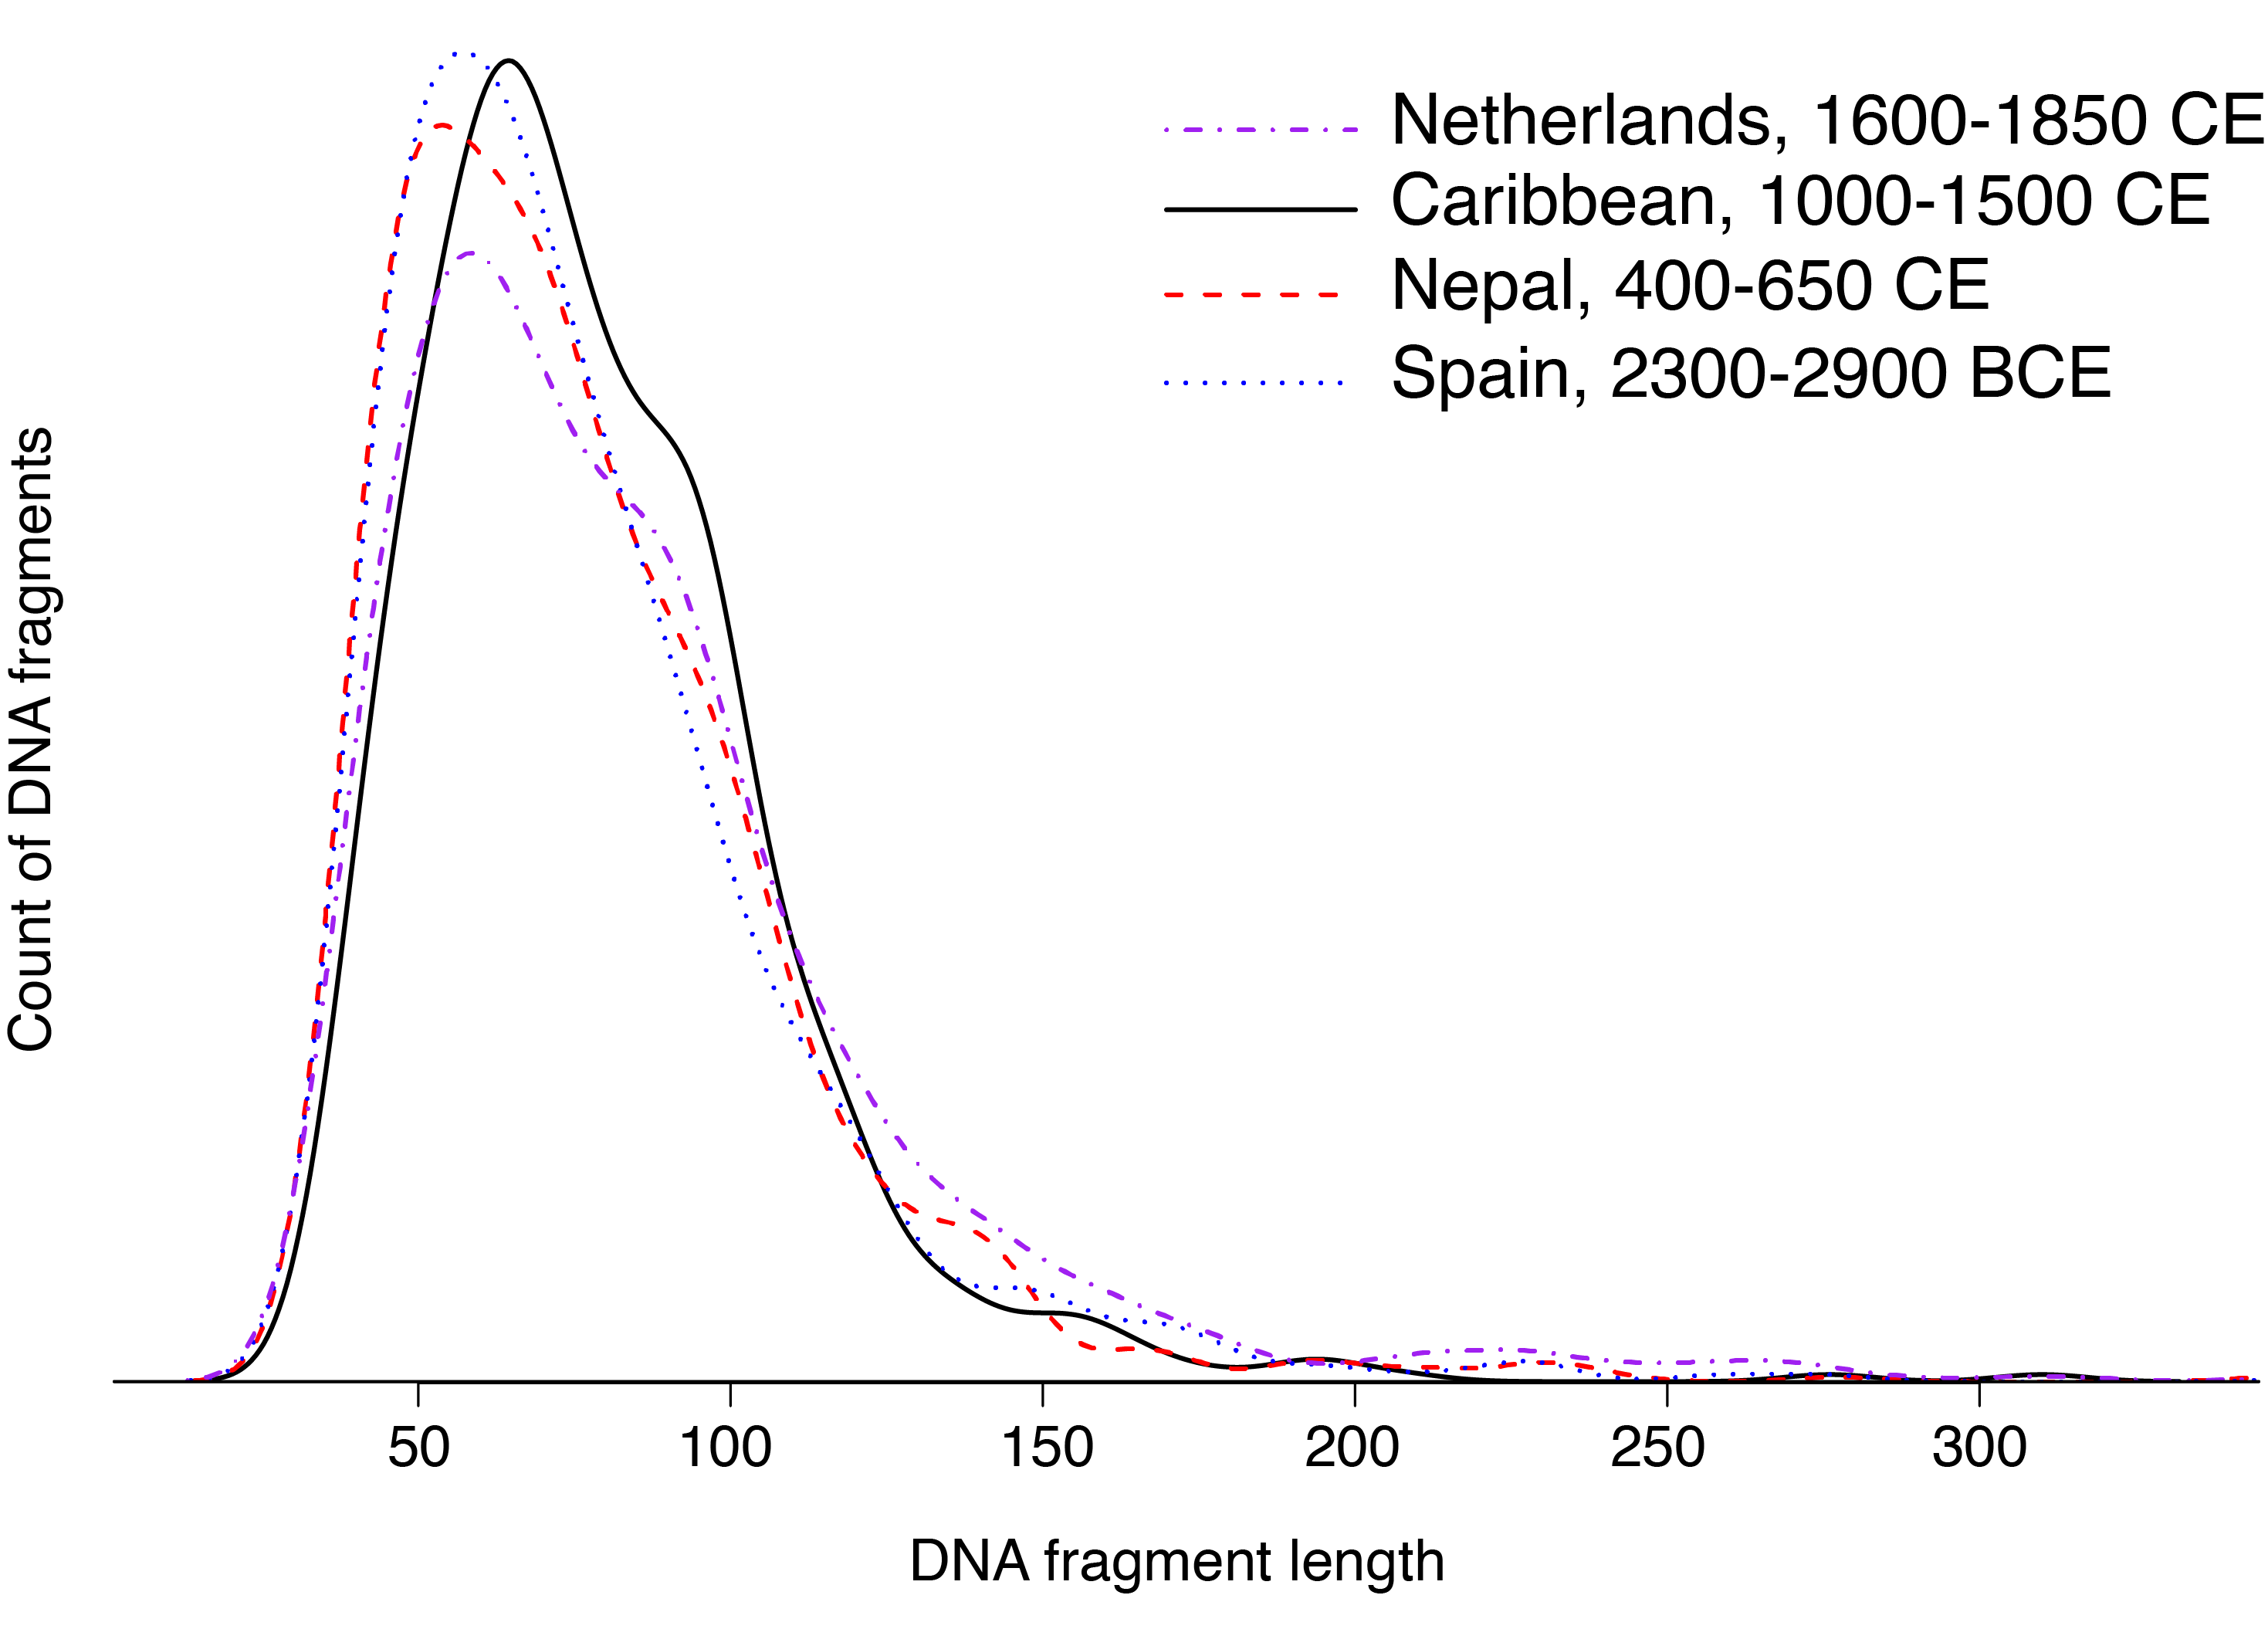
The cumulative effect of nicking over time is a high degree of DNA fragmentation. A smoothed histogram of bacterial DNA fragment lengths measured from ancient dental calculus is shown in Figure 2.9. The mode DNA length is around 50-60 bp long, but the curve sharply declines such that there is almost no DNA present at lengths 150 bp and higher. Almost all DNA within archaeological dental calculus is short, and this is the direct result of nicking and the melting of DNA between nicks. This is how time chops up high molecular weight modern DNA into tiny fragmented ancient DNA.
2.5.2 Cytosine deamination
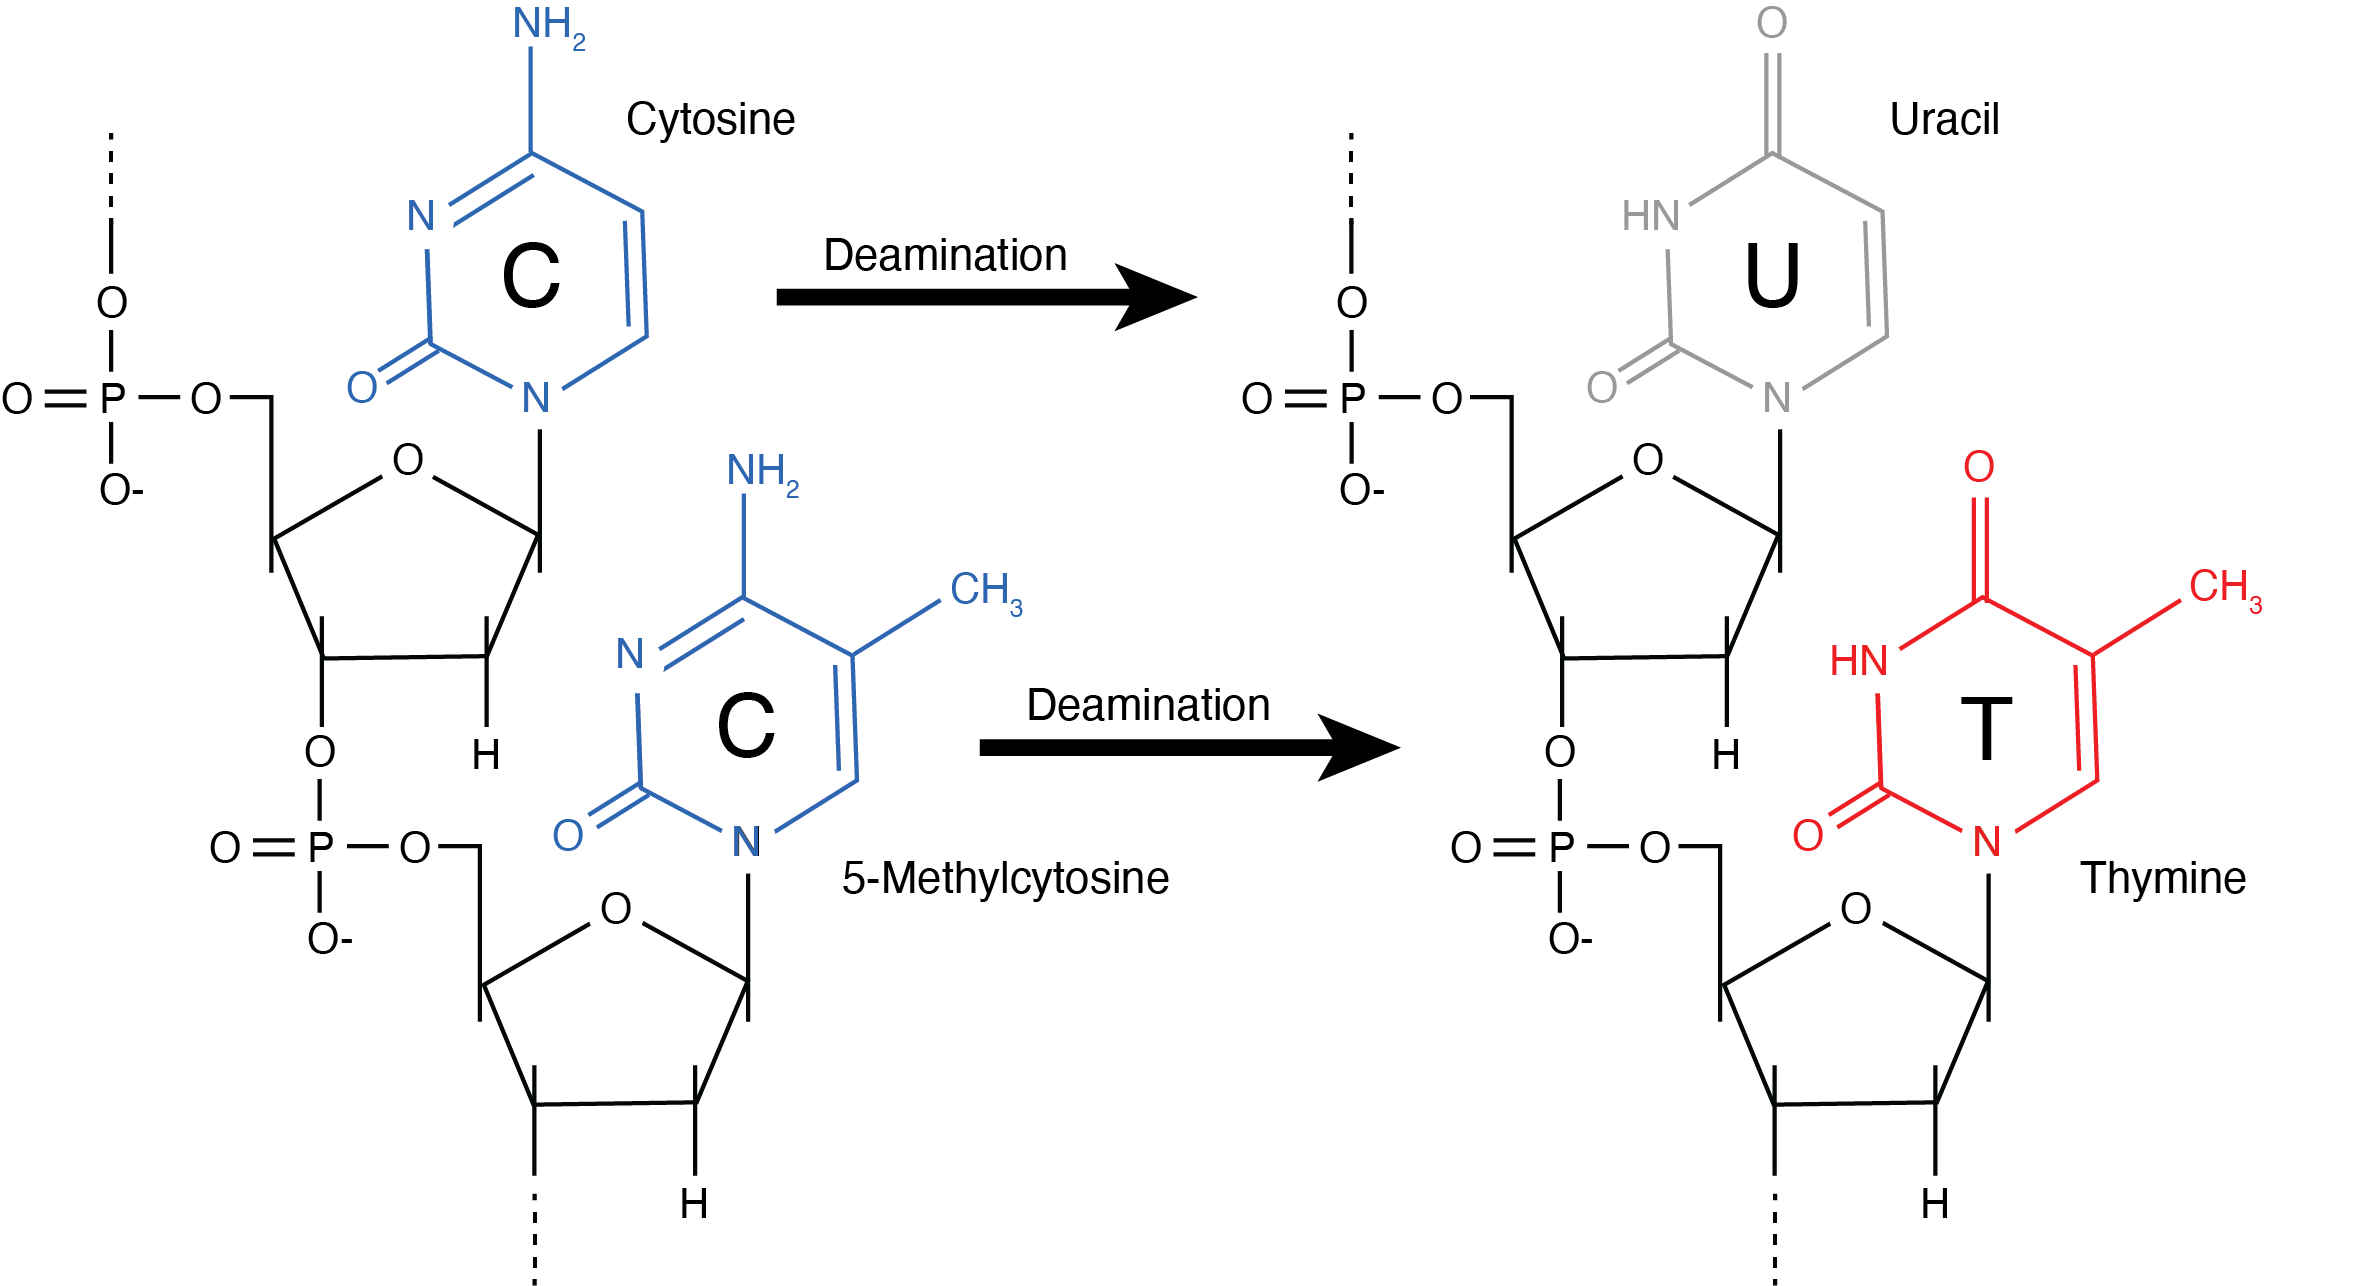
Once fragmented, nucleotides within the single-stranded overhangs become exposed to further chemical attack. The amine group of the cytosine nitrogenous base is particularly vulnerable to hydrolytic attack when not hydrogen-bonded to its complementary guanine, and it undergoes cytosine deamination Figure 2.7. During cytosine deamination, the NH2 group is lost as ammonia, turning the cytosine nitrogenous base into a uracil Figure 2.10. Uracils are not normally found in DNA, and are instead usually found in RNA. Although cytosine deamination may occur at any time in DNA, the rate of its formation is >100 times higher in single-stranded DNA (Frederico, Kunkel, and Shaw 1993; Lindahl and Nyberg 1974). Consequently, ancient DNA molecules tend to accumulate uracils at fragment termini, where they are single-stranded (Bokelmann, Glocke, and Meyer 2020). Most DNA polymerases are not able to correctly recognise uracils, and they generally interpret uracil as a thymine during DNA extension. As a result, ancient DNA sequences contain an overrepresentation of thymines at positions where cytosines are expected. This process produces the characteristic patterns of C->T transitions observed in ancient DNA datasets, as well as the corresponding G->A transitions in the complementary strand.
One important variant of the cytosine deamination process occurs when the cytosine is methylated, as is common in CpG islands involved in epigenetic DNA regulation. Methylated cytosines can also undergo deamination, and when that occurs the cytosine turns into a thymine, not a uracil (Figure 2.10). Using enzymes that specifically target uracils in DNA, some ancient DNA researchers have taken advantage of differences between unmethylated and methylated cytosine deamination products to investigate ancient epigenetics (Hanghøj and Orlando 2019; Briggs et al. 2010; Gokhman et al. 2014).
2.5.3 Damage review
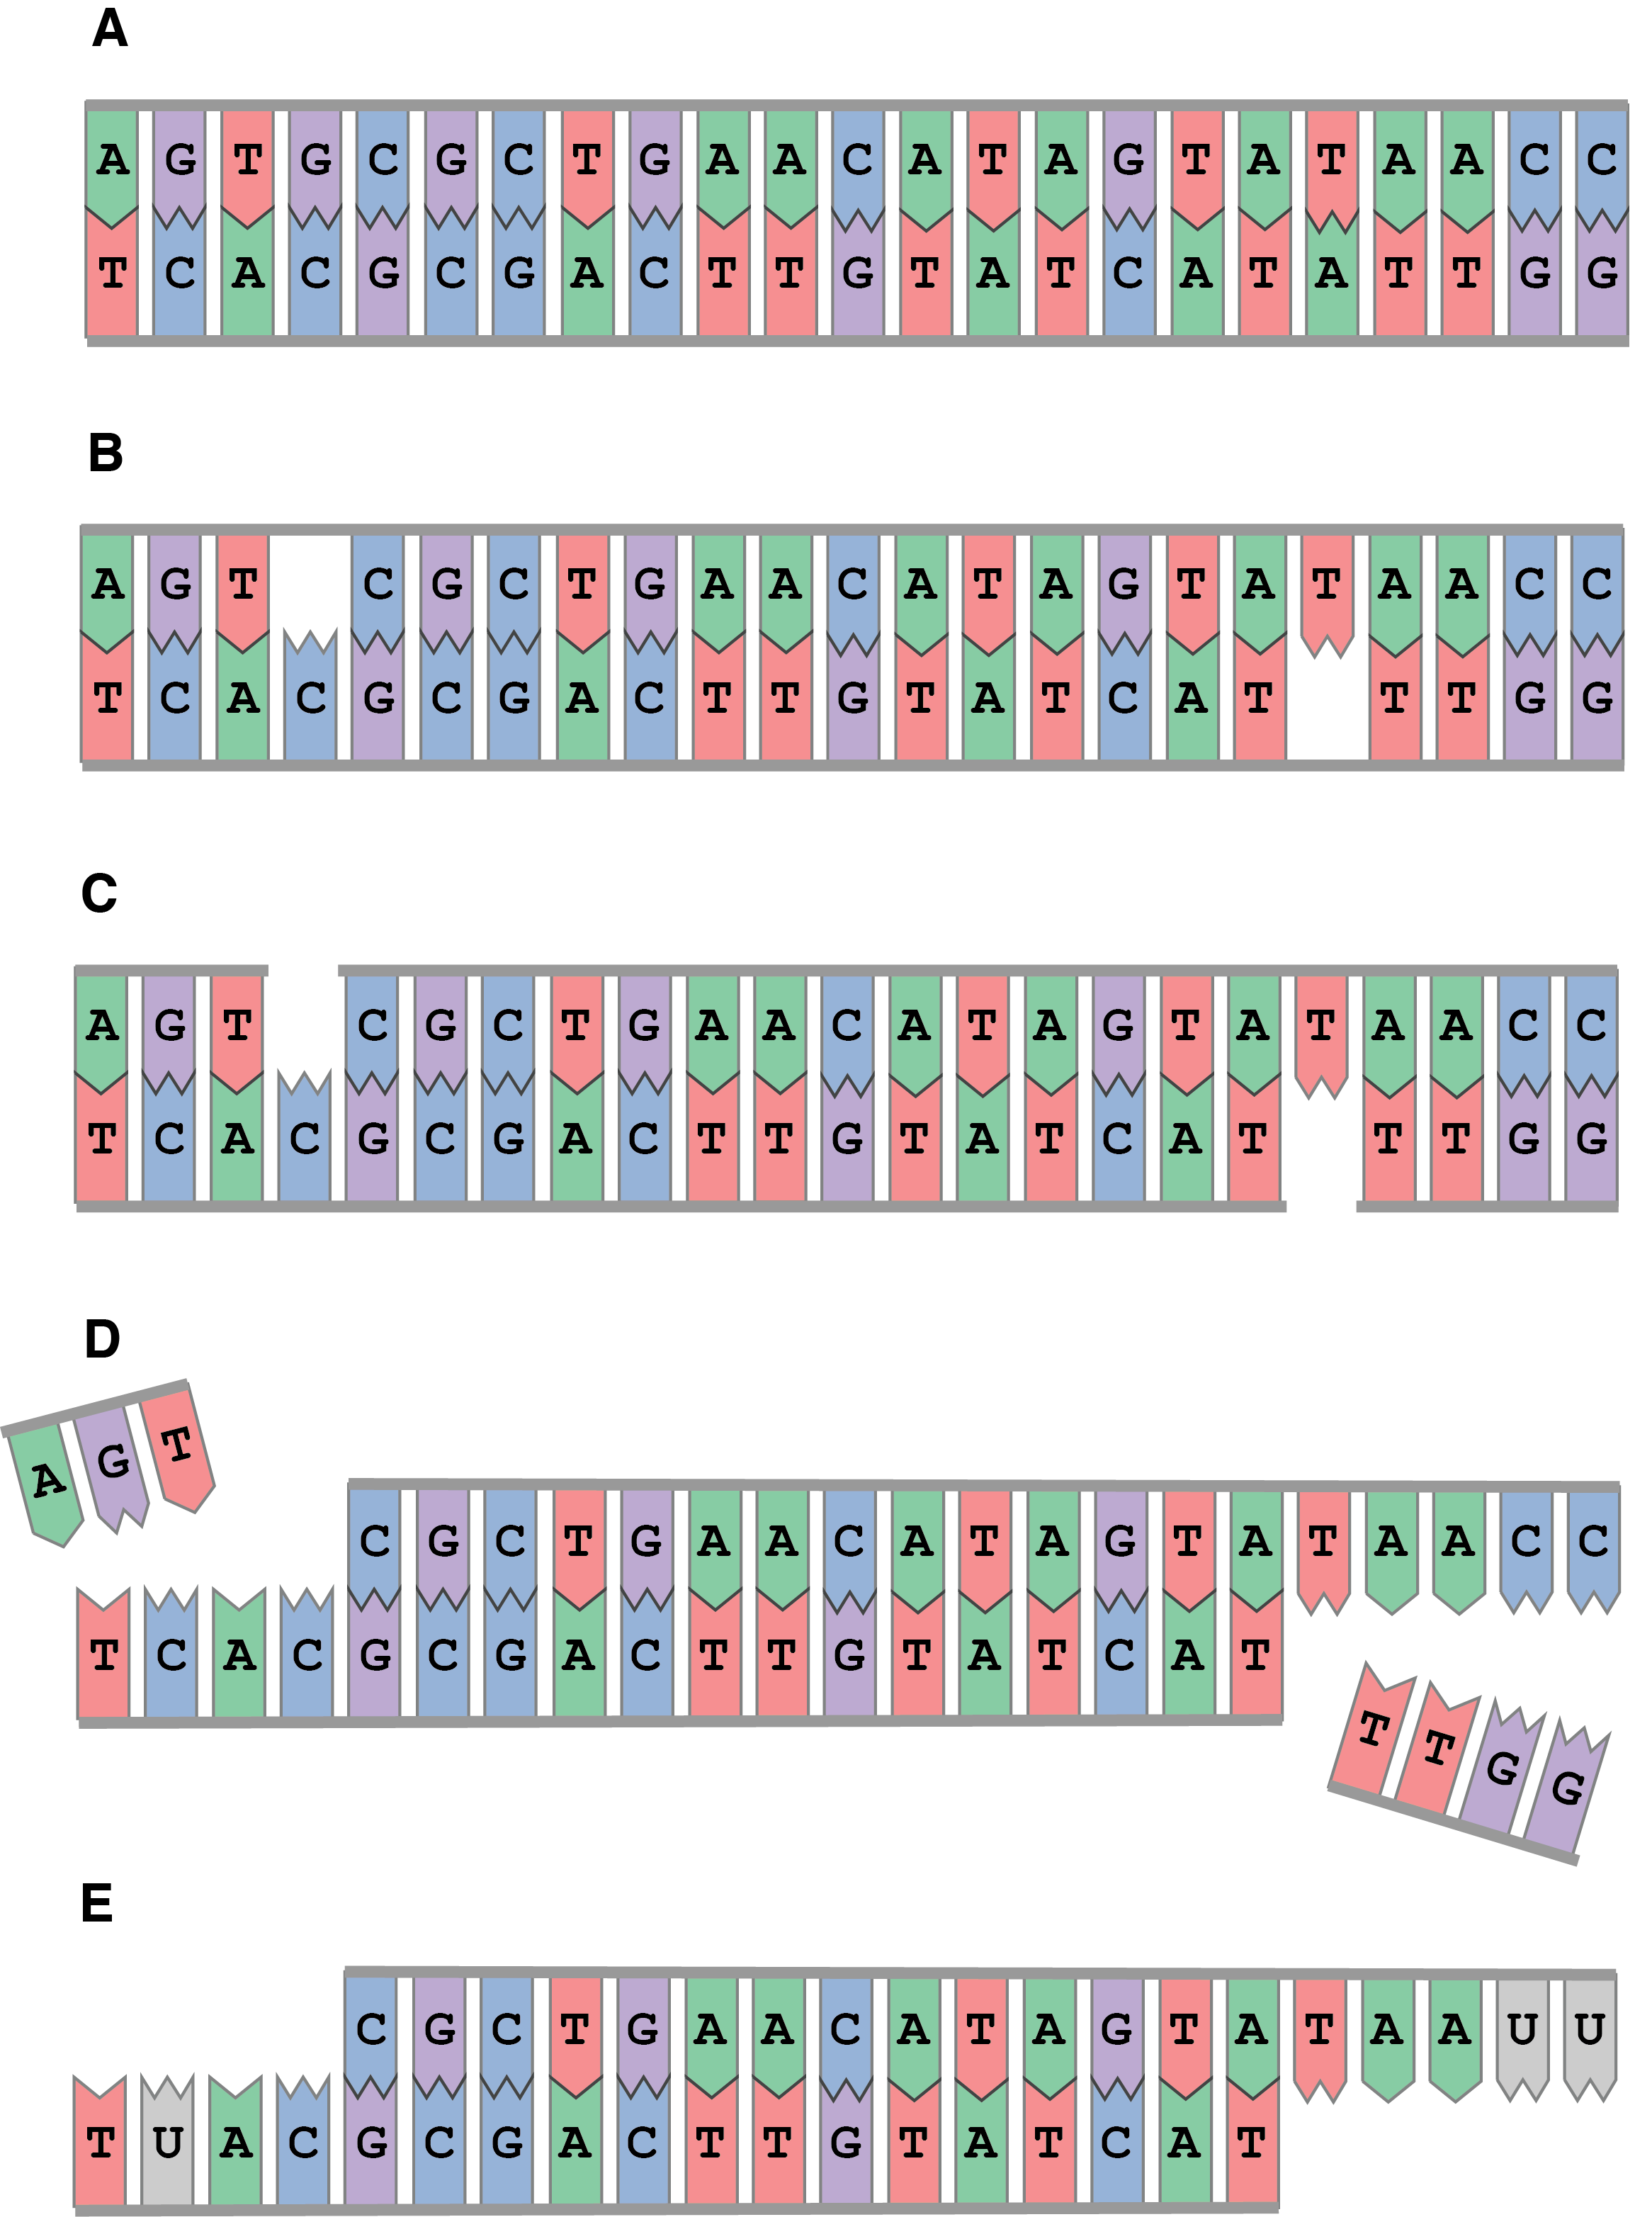
Let’s review the typical progression of DNA damage Figure 2.11. First, DNA undergoes depurination, which results in the random loss of G and A bases. Next, the phosphate backbone undergoes hydrolytic attack at the newly formed abasic sites resulting in single-stranded nicking. If the nicks are closely spaced, the hydrogen bonding between the bases will not be strong enough to hold the double helix together, and the strands will melt. This produces DNA fragments with single-stranded overhangs. The length of the overhang corresponds to the distance between the nicks in the melted strands. Cytosines along the single-stranded overhangs undergo faster rates of cytosine deamination. Unmethylated cytosines deaminate into uracils, while methylated cytosines deaminate into thymines. DNA polymerases interpret both forms of deaminated cytosines as thymines, resulting in an excess of thymines in ancient DNA datasets, particularly at the ends of DNA sequences.
2.6 Getting a handle on damage in ancient DNA
But how was this all figured out? How do we know how ancient DNA decays? The empirical process by which this was determined is a fascinating story, and it occurred relatively recently. Prior to the advent of NGS, it was known that ancient DNA was fragmented, but the length distribution of ancient DNA could not be precisely measured. As recently as 2004, there were still large uncertainties about the typical length of ancient DNA (Pääbo et al. 2004). This was in large part because at the time there were no effective methods for measuring the length of very short, very low abundance DNA. Short DNA is very easily lost during DNA extraction, and many common DNA extraction methods, such as salting-out without a carrier (Gaillard and Strauss 1990), are completely unsuitable for recovering ancient DNA for this reason (Jeong et al. 2016). Low quantities of unamplified ancient DNA also do not visualise well using gel electrophoresis, and if modern soil DNA is also present in the sample, such contaminant DNA tends to overwhelm and obscure the visualization of any ancient DNA. Consequently, prior to 2007 there was great uncertainty about just how long or short ancient DNA really was. Many articles published in the 1990s and early 2000s provide estimates of around 100-500 bp, but those were really just educated guesses. Scientists could tell that ancient DNA was short, but they did not really know how short.
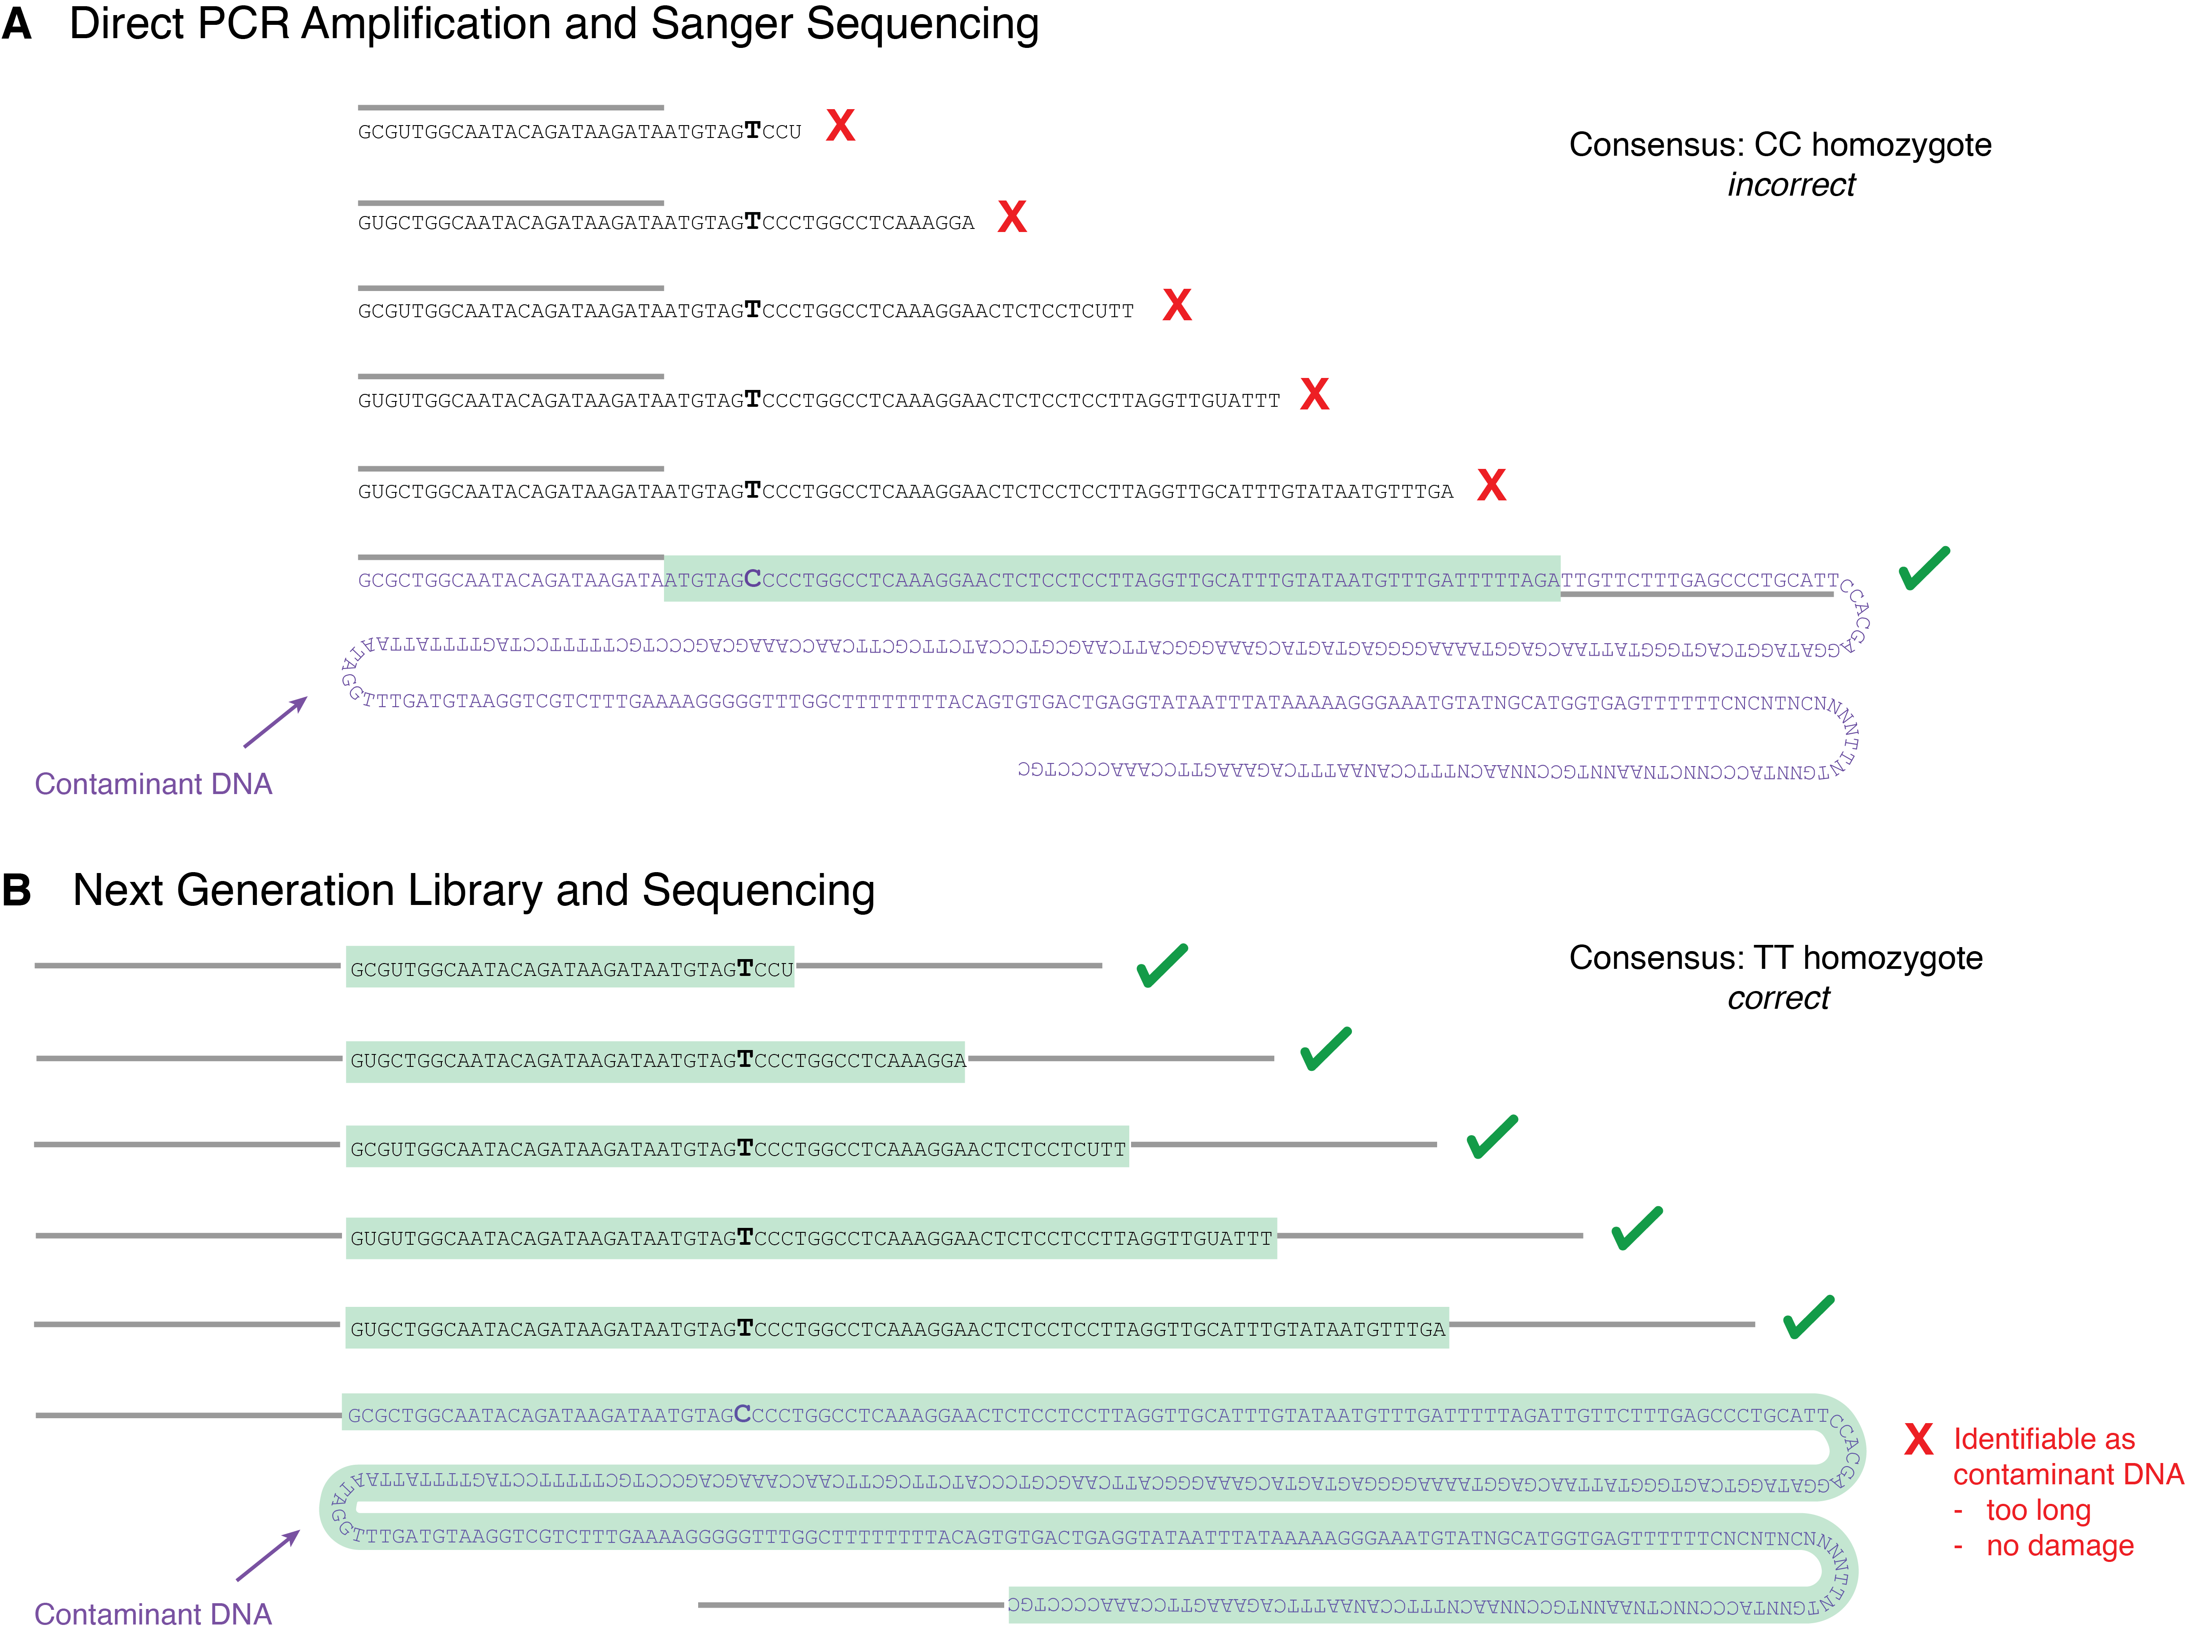
Early ancient DNA studies primarily used a targeted PCR approach to try to amplify DNA templates of about 300-500 bp, but these attempts had very high PCR failure rates and vexing contamination problems (J. J. Austin et al. 1997; Champlot et al. 2010; Hagelberg and Clegg 1991; Handt et al. 1994). Today we know why - it is because ancient DNA is much shorter than this - but at the time this was not yet known. PCR amplification is very sensitive and it can reliably generate amplicons from as few as 4 template molecules under a variety of conditions (Forootan et al. 2017). This makes PCR highly susceptible to even trace amounts of contamination, and if PCR reactions are designed to amplify templates that exceed the length of ancient DNA, the only molecules that will amplify are contaminants (Figure 2.12, panel A). Ancient DNA studies during the 1990s and 2000s, when direct PCR was the primary method of ancient DNA analysis, were thus plagued with intractable problems of irreproducibility and contamination (Cooper and Poinar 2000). Nevertheless, there were successful examples of PCR amplification of ancient DNA, and researchers noted the occasional presence of C->T and G->A miscoding lesions in seemingly authentic ancient DNA amplicons, but they could not yet empirically confirm the precise mechanisms of how they got there (Gilbert et al. 2003; Hofreiter et al. 2001).
At this point in the pre-NGS era, damage was just seen as a problem for the ancient DNA community. It created uncertainty in DNA sequence reconstructions, and it was not recognised to have a benefit. This changed with the development of NGS. NGS represented a radical redesign of the methods used to amplify and sequence ancient DNA, and it eliminated most of the problems that had mired earlier PCR-based ancient DNA studies in ambiguity and uncertainty (Figure 2.12, panel B). With NGS, it was no longer necessary to design PCR primer-binding sites on the actual ancient DNA template, which meant that much shorter DNA fragments could be analysed and sequenced. Instead, oligos containing universal priming sites were simply ligated onto the ends of the ancient DNA molecules. This made it possible for the first time to recover all of the ancient DNA in a sample, and, in most cases, to sequence each ancient DNA molecule in its entirety–from beginning to end.
Once all of the DNA in a sample could be analysed, it became possible to measure the true size of ancient DNA and to determine the processes of DNA degradation in order. This was first achieved in 2007 in a study of Neanderthal DNA by Adrian Briggs and colleagues at the Max Planck Institute for Evolutionary Anthropology (MPI-EVA) in Leipzig, Germany (Briggs et al. 2007). Subsequent improvements in ancient DNA recovery during DNA extraction by Jesse Dabney and colleagues at the MPI-EVA showed that ancient DNA was much shorter than previously thought (Dabney et al. 2013), and that most DNA extraction protocols were simply not capable of recovering such short DNA fragments. The biased recovery of only relatively long DNA molecules using most extraction protocols had given the false impression that ancient DNA was in low abundance but relatively long (~100-500 bp). Together, these studies instead revealed that archaeological samples actually contain much more ancient DNA than previously thought, but that this ancient DNA is highly fragmented and degraded and therefore requires specialised protocols to recover, sequence, and analyse.
Today, we know that most ancient DNA is very short - on the order of about 30 to 50 bp long on average. Shorter DNA than this is very difficult to recover (Glocke and Meyer 2017), and also not desired since sequences <30 bp cannot be unambiguously identified to a specific taxonomic group or region of the genome (Filippo, Meyer, and Prüfer 2018). The process of piecing together the evidence to understand the progression of DNA degradation was a key achievement in the history of palaeogenomics. It turns out that DNA damage is quite predictable, and this has allowed scientists to turn the problem of DNA damage into a solution. There are now a number of software tools that specifically identify and quantify DNA damage as a way of authenticating ancient DNA and distinguishing it from modern DNA contaminants (Jónsson et al. 2013; Skoglund et al. 2014). This work has been crucial for reconstructing extinct hominin genomes, and it is now used today for samples of all ages, depending on context, to separate ancient and modern DNA and to authenticate well-preserved archaeological samples.
2.6.1 Authenticating the Vindija Neanderthal DNA
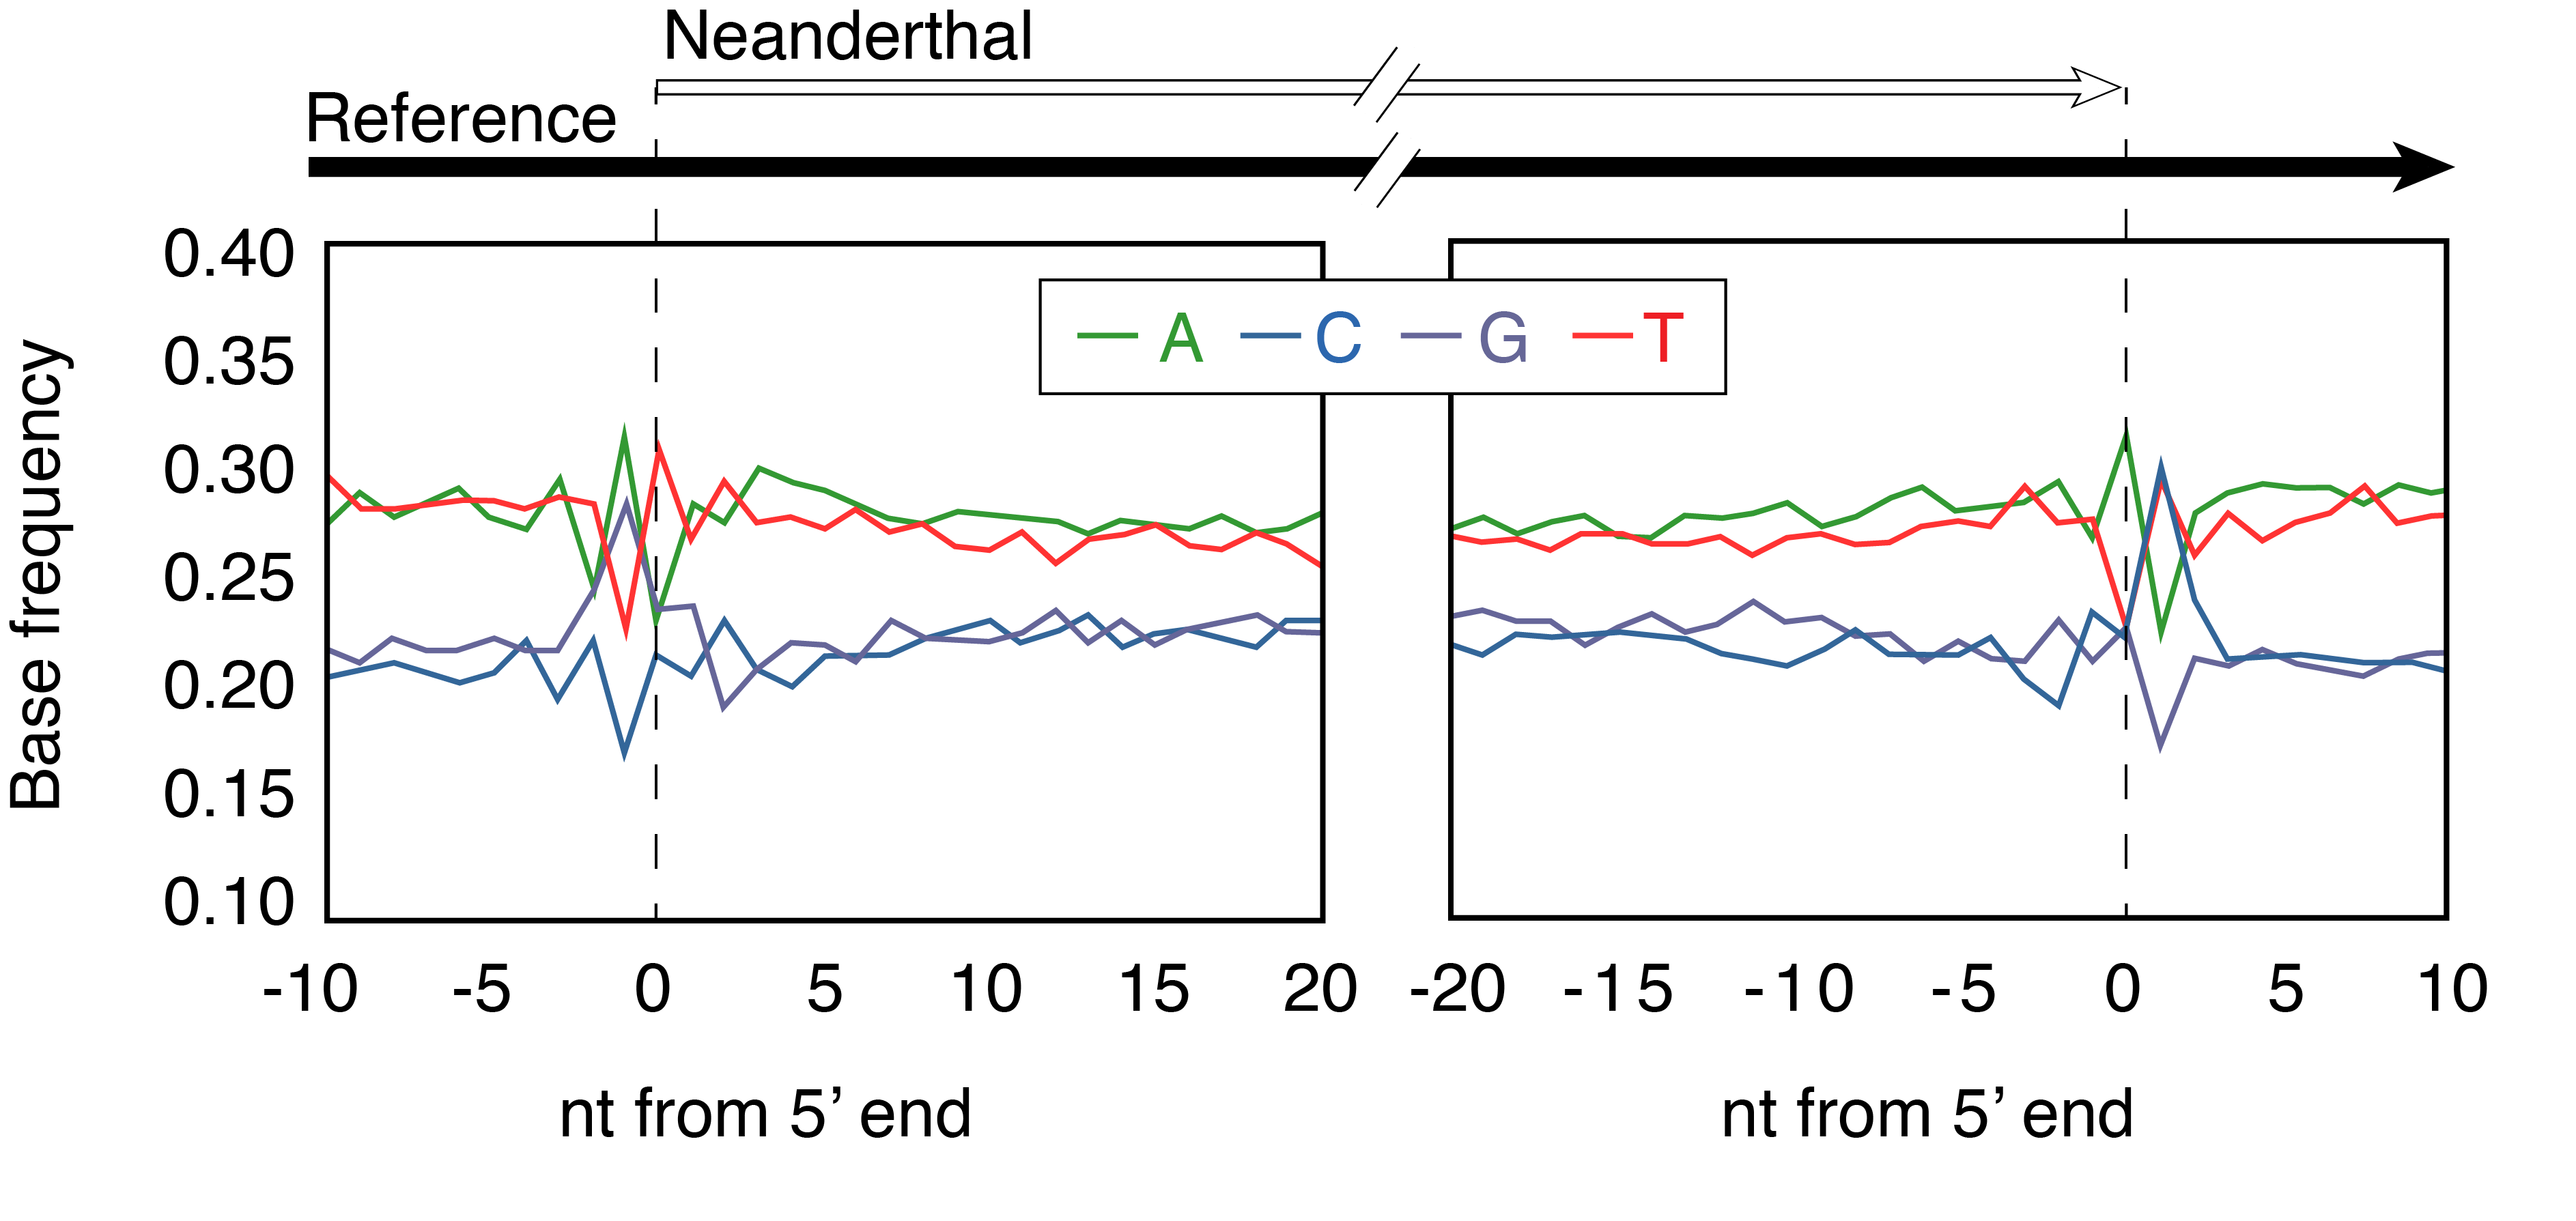
Let’s take a closer look at the 2007 study on ancient DNA damage that proved to be such a game-changer in the field (Briggs et al. 2007). Adrian Briggs and colleagues were trying to solve a problem - how do you distinguish Neanderthal DNA from the DNA of all of the humans who have touched the Neanderthal bone? And how do you recognise real Neanderthal DNA once you have it? It was a pressing problem because the first Neanderthal DNA sequences, published just a year before (R. E. Green et al. 2006; Noonan et al. 2006), had undergone intense scrutiny (Wall and Kim 2007) and were shown to be compromised by contamination. Using data generated by a newly available NGS technique developed by 454 Life Sciences known as pyrosequencing, the team analysed the patterns of DNA damage present in the DNA of the Vindija Neanderthal. First, they examined the DNA sequence context around strand breaks in ancient DNA, something that could not be done using data generated using conventional targeted PCR. They aligned the 454-sequenced ancient DNA fragments to a reference genome and found that there was a bias towards G and A nucleotides in the -1 position, meaning one position upstream of the ancient DNA sequence in the alignment. In other words, the ancient DNA seemed to have disproportionately broken right after a purine, either G or A (Figure 2.13). A different pattern was observed at the 3’ end of the ancient DNA molecule, where the +1 position showed an overrepresentation of C and T nucleotides. This can be attributed to repair steps occurring during the construction of the NGS-sequencing library, such that the observed pattern at the 3’ +1 position is simply the reverse complement of the 5’ -1 position. We’ll return to this topic later in the chapter.
The observations of Briggs and colleagues matched predictions previously made by Lindahl that purines were particularly susceptible to hydrolytic attack and depurination, after which the sugar phosphate backbone undergoes hydrolysis 3’ to the depurinated site (Lindahl 1993). This pattern observed in the Vindija Neanderthal was then confirmed to be present in mammoth and cave bear DNA datasets, suggesting it was a generalised pattern characteristic of ancient DNA fragmentation.
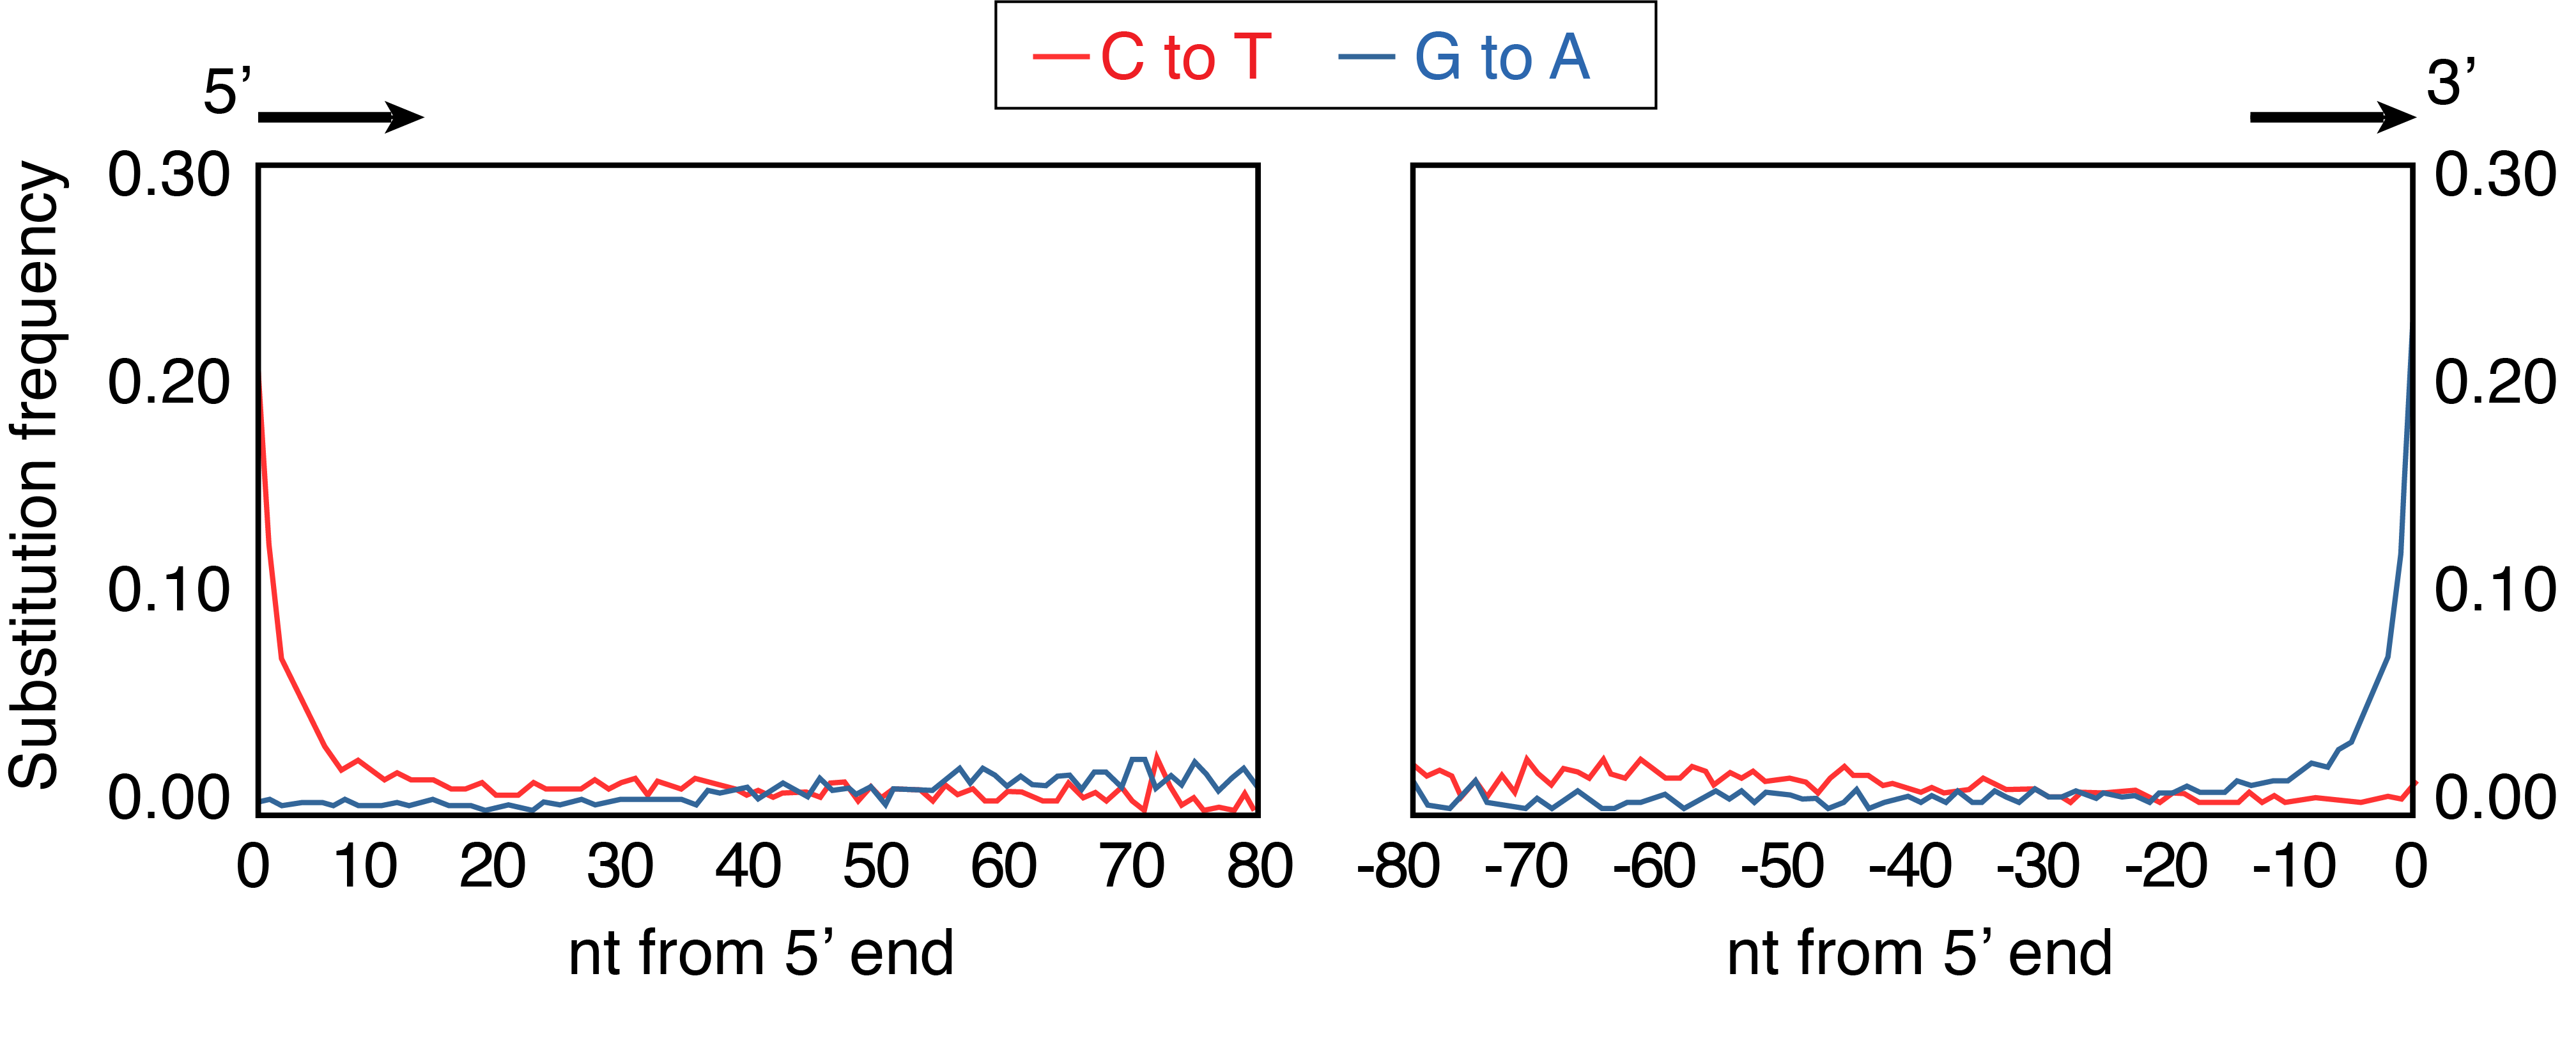
Briggs and colleagues also described a second damage-related pattern present in the Vindija Neanderthal DNA sequences: an excess of errors or differences from the reference at the ends of each DNA sequence (Figure 2.14). Specifically, they observed a high substitution frequency of C->T at the 5’ end and of G->A at the 3’ end of the DNA molecule. Corresponding again to Lindahl’s predictions, the 5’ overrepresentation of T could be explained as accelerated cytosine deamination in the single-stranded overhang at the sequence 5’ terminus, while the 3’ overrepresentation of A was simply the reverse complement. The deamination pattern was strikingly clear, and the elevated 5’ C->T substitution frequency declined to baseline values by approximately the 10th bp of the DNA molecule, suggesting that the single-stranded overhangs were mostly less than 10 bp long - a pattern in agreement with melting temperature predictions. The plot was nicknamed the smile plot because it resembles the shape of a smile.
2.7 DNA damage: from problem to solution
With the advent of NGS sequencing and the revelation that ancient DNA undergoes empirically predictable patterns of DNA degradation, DNA damage went from being an annoying and intractable problem to a powerful solution for DNA authentication. Next we will review the smile plot in detail, including how it is influenced by NGS library construction methods and how software tools designed to characterise deamination patterns are used to authenticate ancient DNA today.
2.7.1 The ‘smile plot’
When interpreting ancient DNA damage patterns, it is critical to know that the characteristic shape of the ancient DNA smile plot is the product of two distinct processes. The first is the DNA degradation process itself, whereby depurination leads to nicking and melting, which produces single-stranded overhangs at the ends of DNA molecules where cytosines deaminate at a rate >100 times faster than in double stranded DNA. The second process relates to the asymmetric behaviour of repair enzymes used during NGS library construction, which we will discuss now.
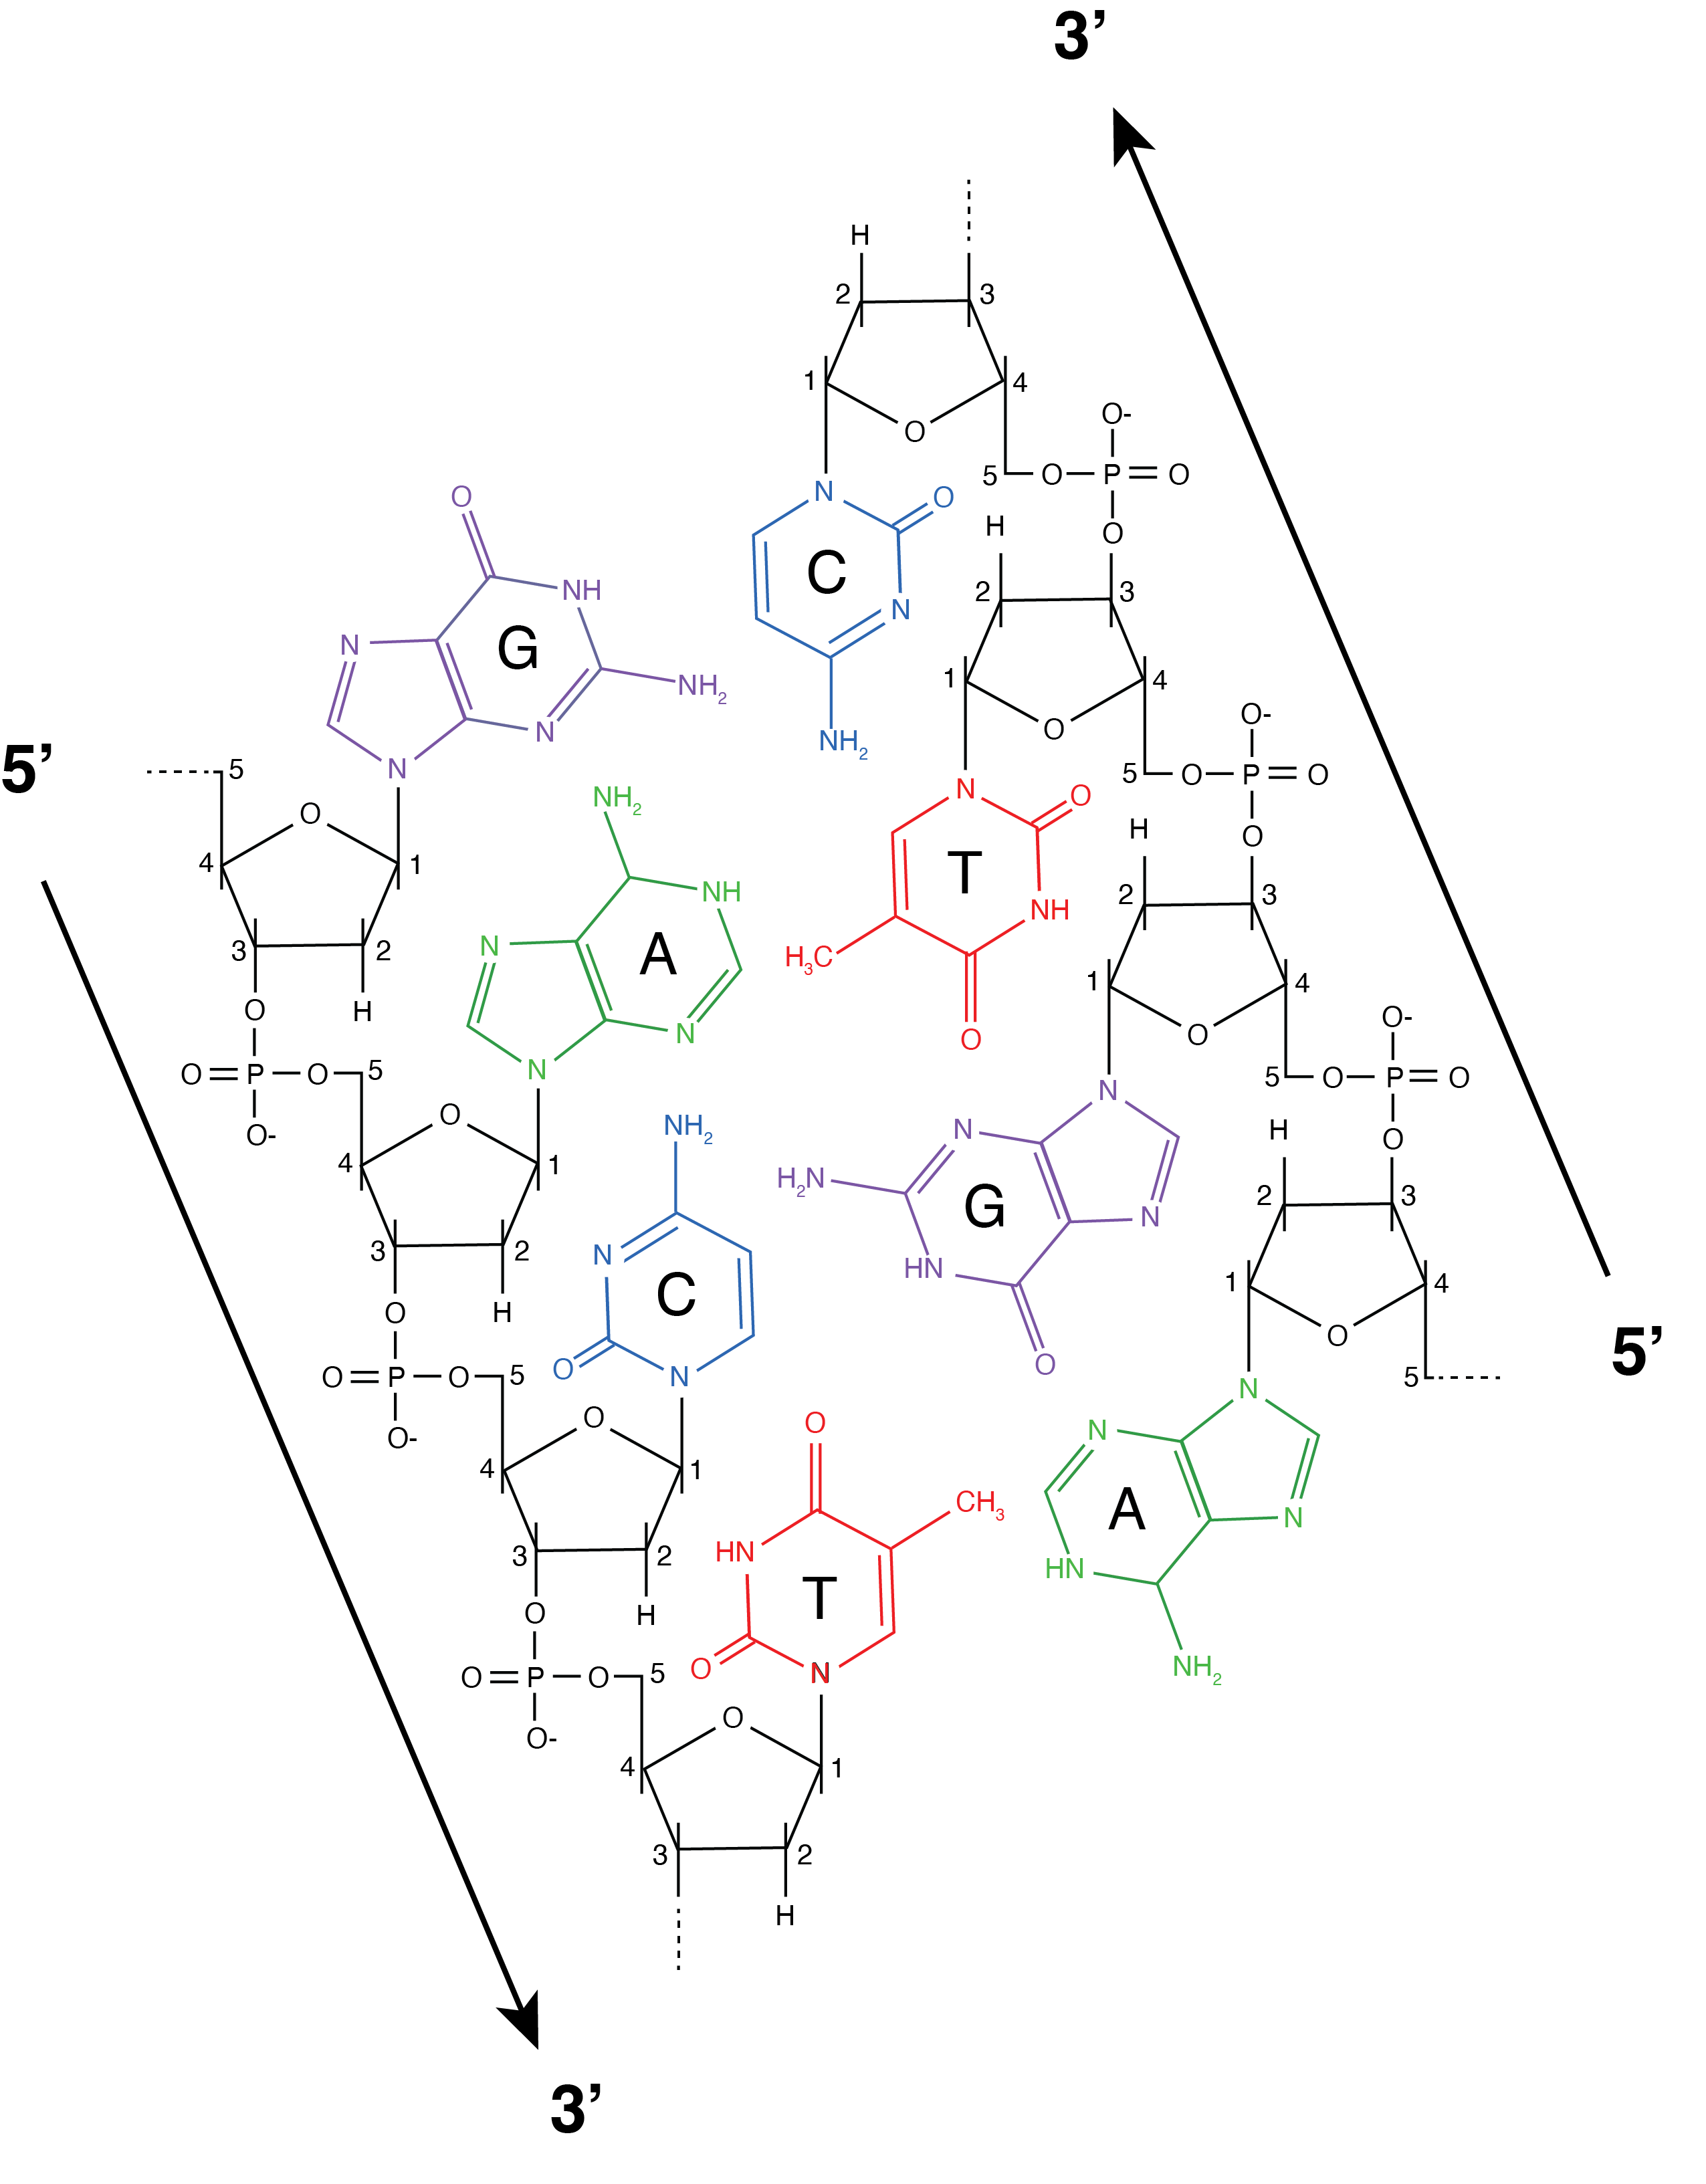
Up until now, we have focused on the DNA damage patterns present on the 5’ ends of the DNA fragments, and we have mostly ignored the DNA damage on the 3’ ends. Why? It is because the damage observed on the 3’ ends of ancient DNA molecules depends on the NGS library construction method. In order to understand this, it is important to recall that each strand of DNA has an orientation, or reading order, that runs from the 5’ end of the molecule to 3’ end of the molecule, and that the orientation of the two strands that make up the DNA double helix run in opposite directions. The 5’ to 3’ nomenclature refers to the position of the carbon atom in the 2-deoxyribose sugar that connects to the phosphate backbone (Figure 2.15). The 5’ to 3’ orientation of DNA is important because most enzymes involved in DNA copying and repair only work in one direction of the orientation. So, for the enzymes we use to manipulate DNA during DNA amplification and sequencing it matters very much which side of the DNA fragment is 5’ and which side is 3’.
Let’s next examine a hypothetical pool of double-stranded DNA as it degrades into ancient DNA (Figure 2.16, panels A-C). In this pool, each ancient DNA molecule can exhibit one or more forms of damage in different combinations. For example, two nicks may occur on the same DNA strand, resulting in one strand having both 5’ and 3’ overhangs and the other strand having none; or nicks may occur on opposite DNA strands, resulting in both strands having a 5’ overhang or both strands having a 3’ overhang (Figure 2.16, panel B). Over time, cytosines then deaminate to form uracils on these single stranded overhangs (Figure 2.16, panel C). The presence of these overhangs interferes with the steps needed to prepare the DNA for sequencing, so the first step of DNA library construction is to end-repair the DNA to make the strands fully double-stranded with blunt ends (Figure 2.16, panels D-E). This makes the DNA suitable for ligating on adapters that make the DNA “readable” by the sequencing instrument. DNA repair is performed with T4 polymerase, a type of polymerase that originally came from the T4 virus, a bacteriophage that infects Escherichia coli. T4 polymerase has important properties that must be kept in mind in order to understand how its repair function will affect downstream sequences. When encountering DNA with single-stranded overhangs, T4 polymerase will trim back any 3’ overhangs (Figure 2.16, panel D), and fill in any 5’ overhangs (Figure 2.16, panel E). This removes approximately half of the uracils in the pool of ancient DNA, and it adds an adenine opposite the remaining uracils (recall that polymerases treat uracils like thymines). The result is that uracils only remain on the 5’ ends of the molecules, while the complementary adenines are found only on the 3’ prime ends of the molecule - a pattern that is made even more visible if we imagine rearranging all the strands in the same orientation (Figure 2.16, panel F). This asymmetric behaviour of T4 polymerase is what produces the asymmetric appearance of the ancient DNA smile plot, with an excess of C→T substitutions on the 5’ (left) side of the plot, and an excess of G→A substitutions on the 3’ (right) side of the plot (Figure 2.14).
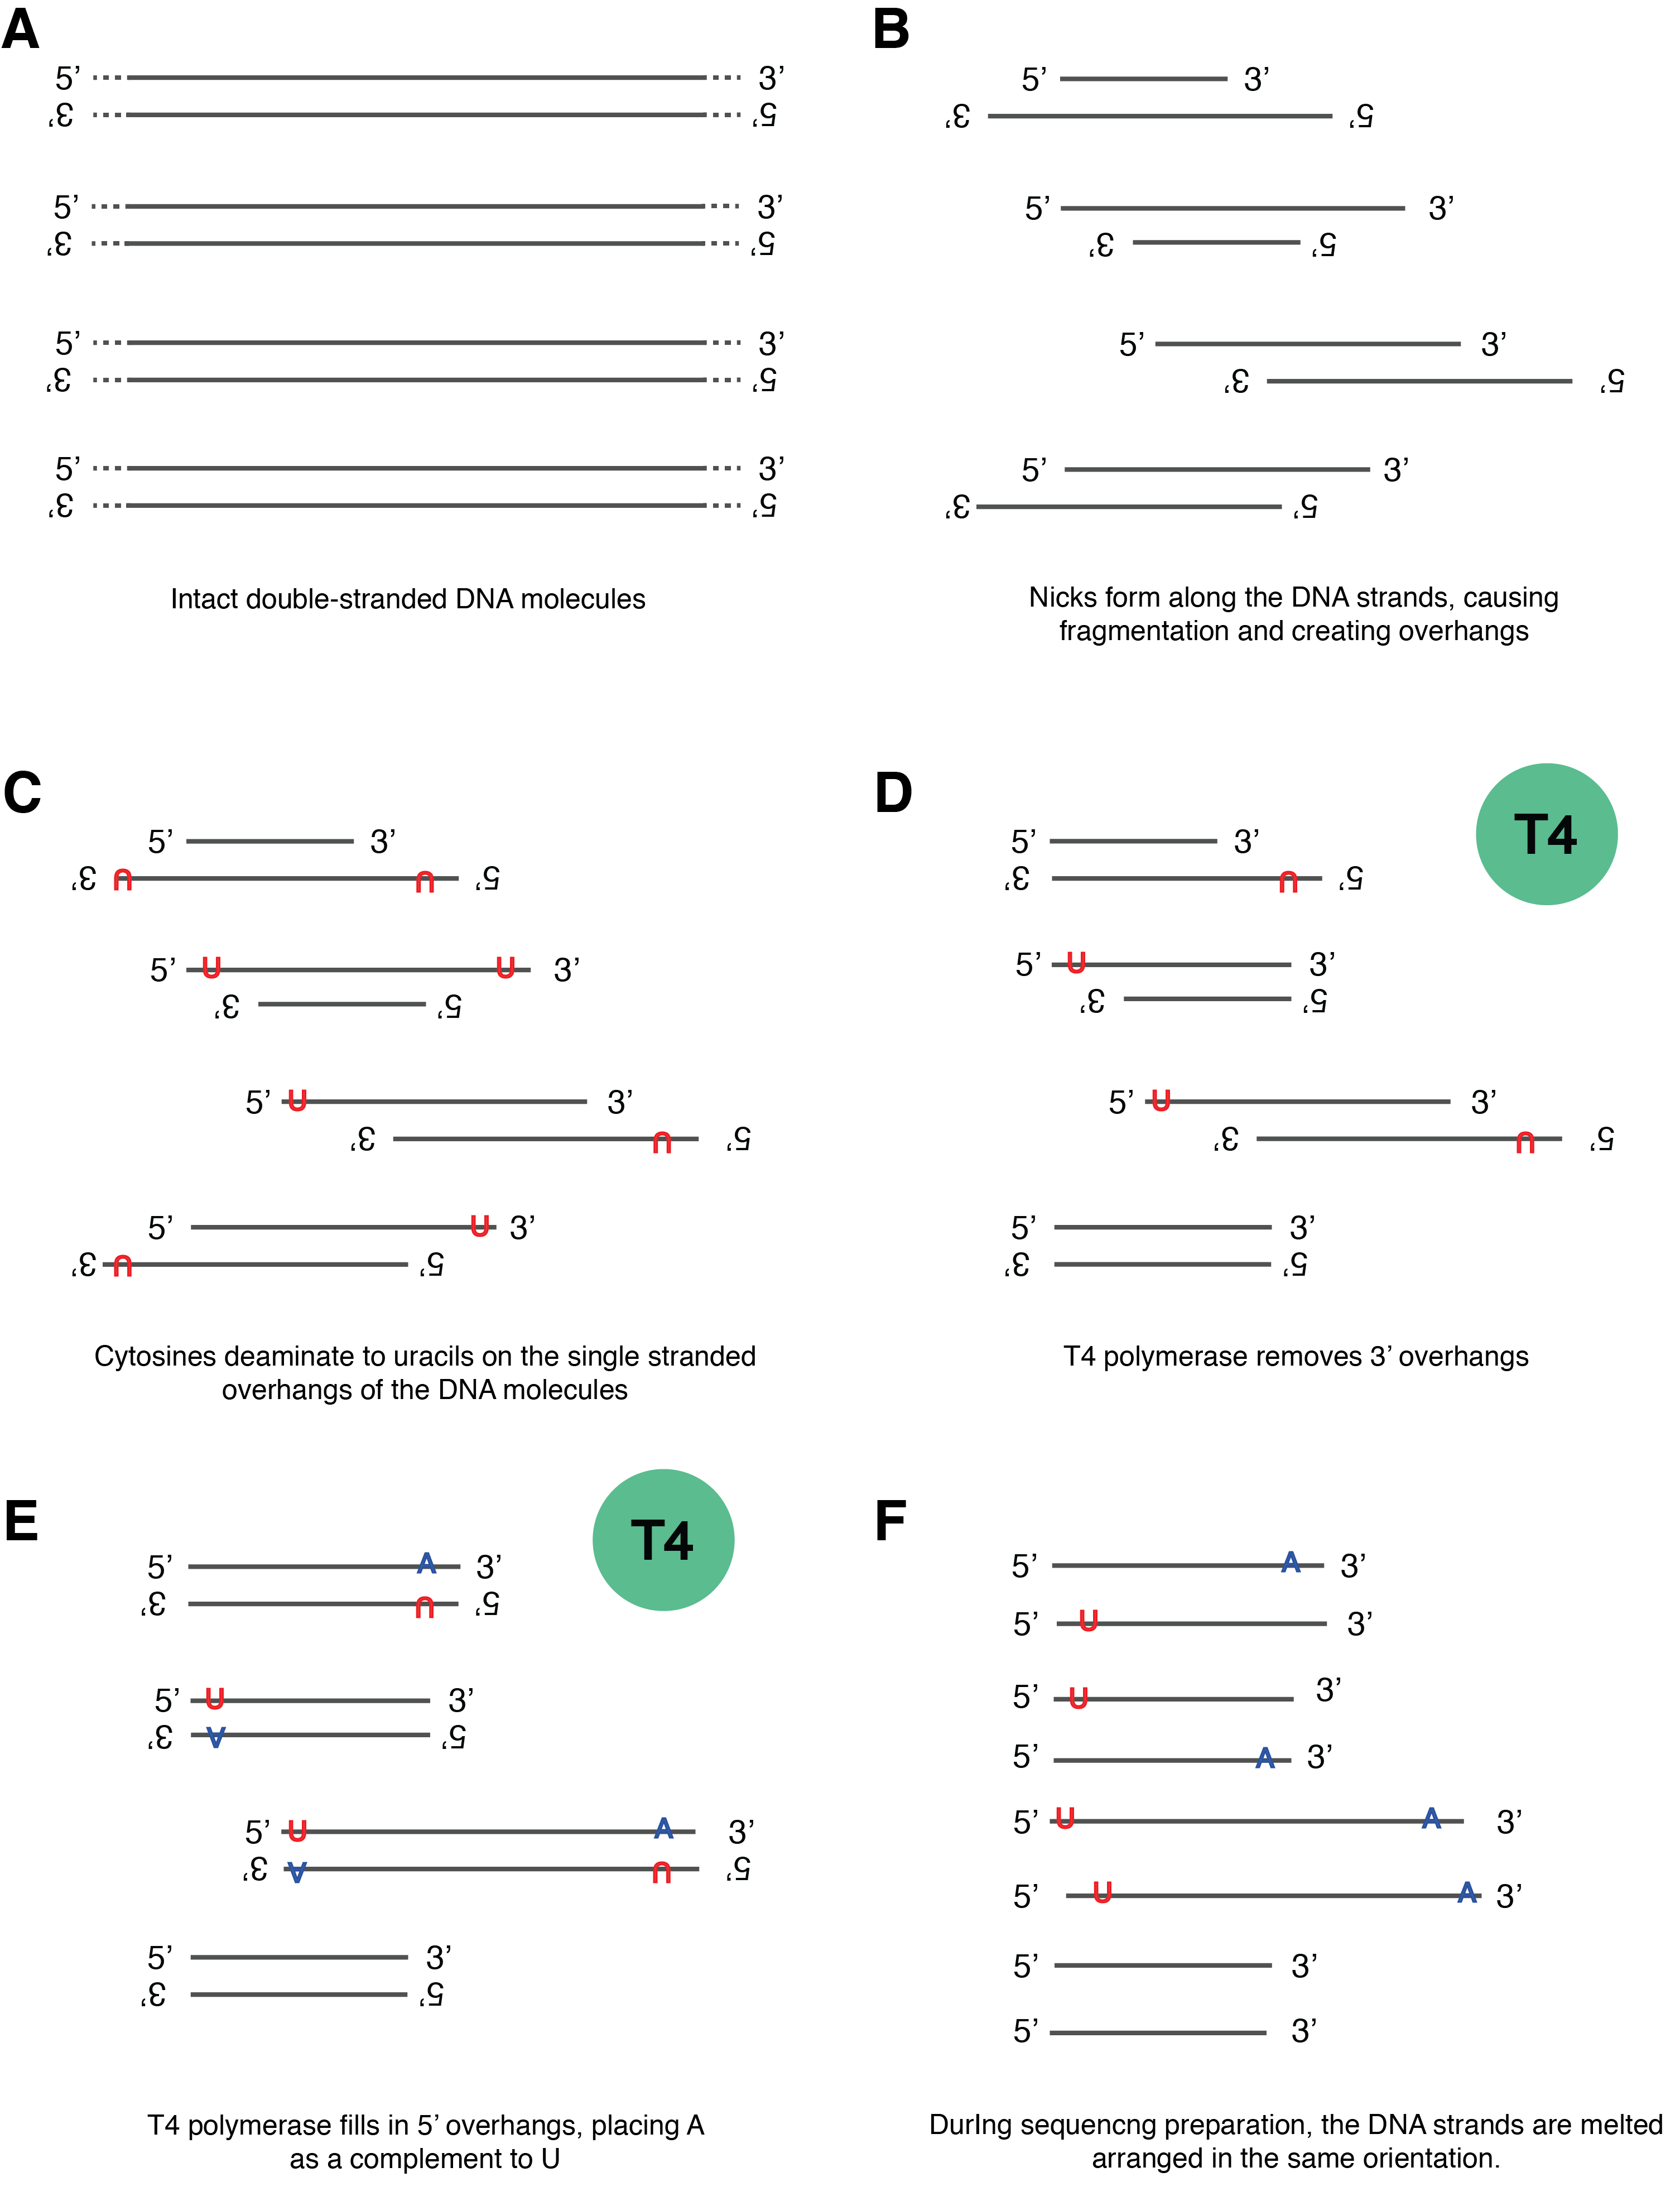
To review, the end result of the T4 polymerase damage repair process of ancient DNA is a set of fully double-stranded DNA with blunt ends (no overhangs) and an asymmetrical removal of half of the damage present in the original ancient DNA molecules. Some DNA molecules (those with damage only on their 3’ overhangs) even end up with no damage at all after repair. An important consequence of this asymmetric loss of DNA damage on 3’ overhangs means that ancient DNA prepared using a double-stranded preparation method using T4 polymerase will never reach a terminal substitution rate of 1.0, and instead the maximum substitution rate observed under normal conditions of DNA degradation is 0.5.
2.7.2 DNA damage tools
The predictable patterns of DNA decay combined with knowledge of how DNA repair mechanisms modify these patterns allow for the development of software to authenticate ancient DNA sequences. The first such publicly available automated tool was mapDamage (Ginolhac et al., 2011), which was later updated to mapDamage 2.0 (Jónsson et al. 2013). Developed in the group of Ludovic Orlando, the tool aligned and compared ancient DNA sequences to reference genomes to visualise patterns of depurination and cytosine deamination, much like those originally presented in the study of the Vindija Neanderthal (Briggs et al. 2007). The same principles were incorporated into PMDtools (Skoglund et al. 2014), a suite of software tools developed by Pontus Skoglund to enable the separation of damaged and non-damaged DNA sequences within a mixture, an application that is helpful in removing modern DNA sequences from heavily contaminated ancient DNA datasets. More recently, the tool DamageProfiler (Neukamm, Peltzer, and Nieselt 2021) was developed to allow a similar level of damage characterization, but in a more computationally efficient manner that decreases runtime and uses less memory. However, because each of these tools was designed with the goal of characterizing DNA damage for a single species of interest, they can be difficult to apply to large microbial metagenomics datasets, such as those generated from ancient microbiomes or sediments. The tool PyDamage (Borry et al. 2021), which allows damage profiling for multiple genomes within a sample, was developed to solve this problem, and the tool can also provide reference-free estimates of DNA damage when combined with de novo assembly.
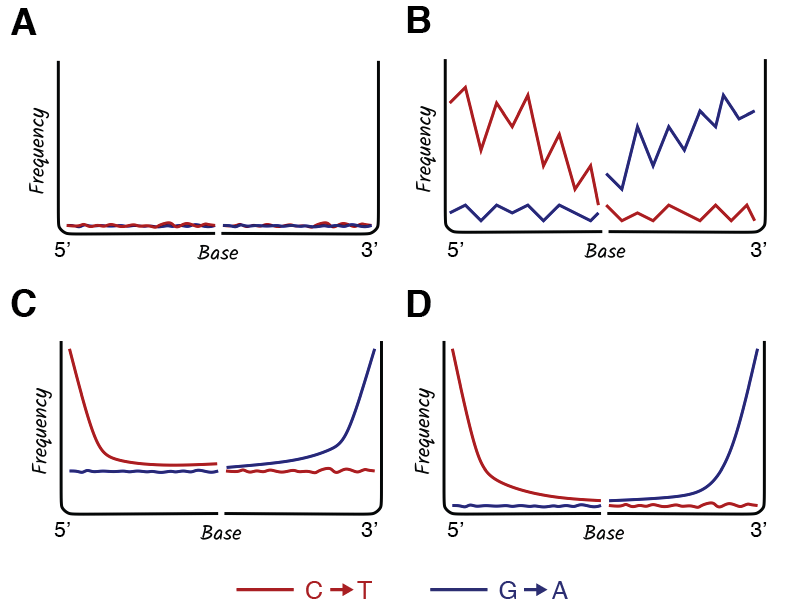
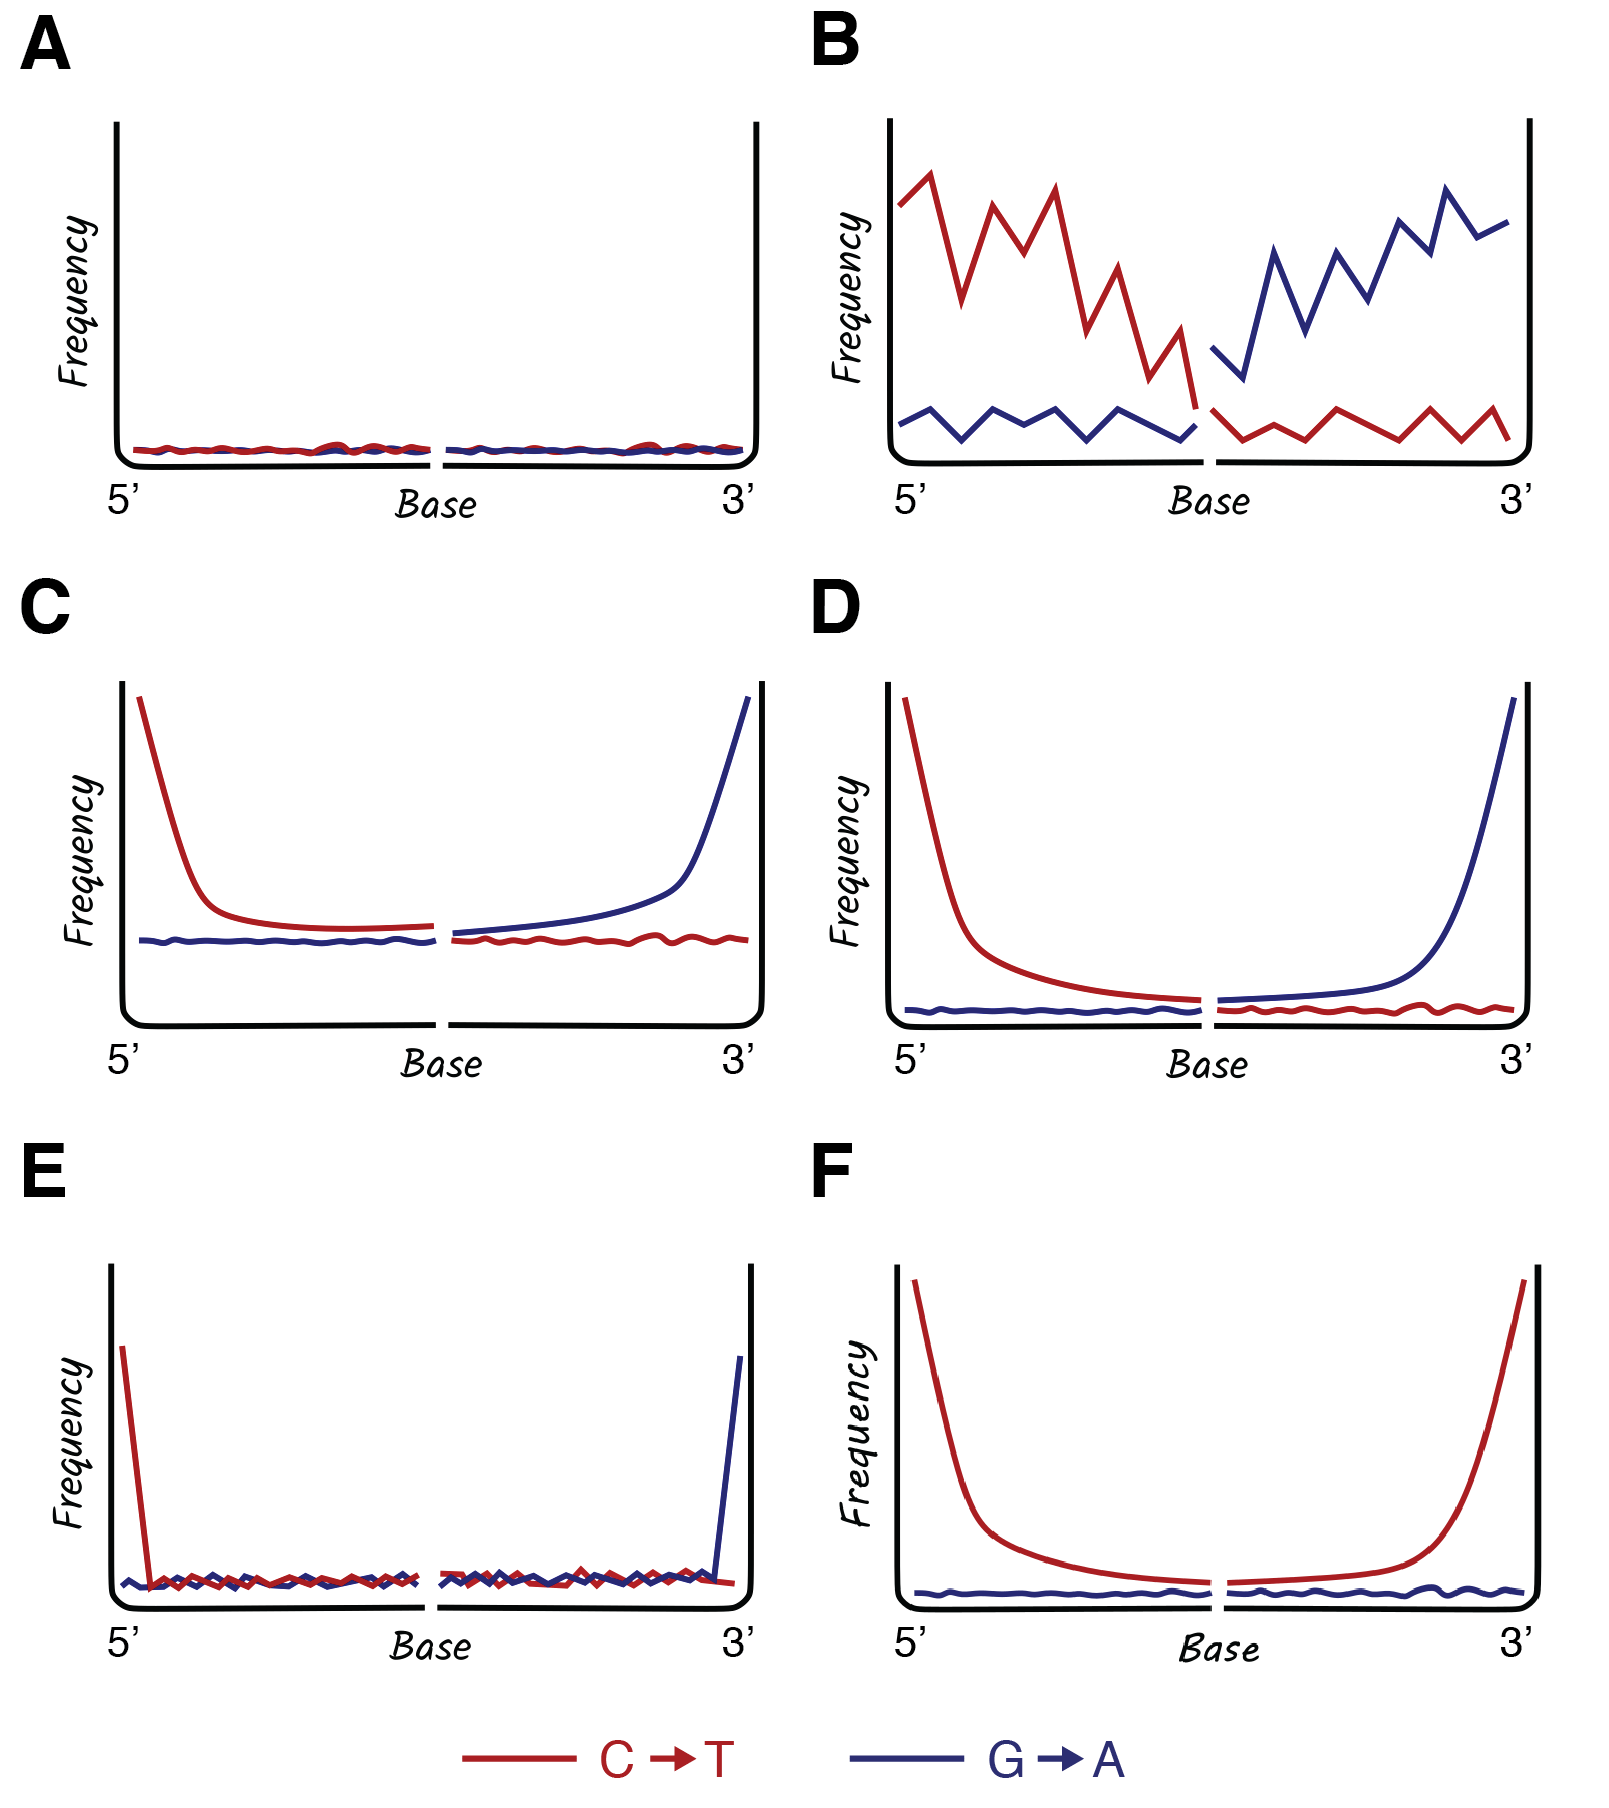
Collectively, DNA damage tools are an essential resource in ancient DNA analysis, as they allow researchers to authenticate ancient DNA sequences, estimate sample preservation, and troubleshoot potential problems (Figure 2.17). For example, the absence of DNA damage observed in Figure 2.17 (panel A) indicates that the DNA present in this dataset is likely modern. The spiky damage pattern in Figure 2.17 (panel B) indicates that too few sequences were used to perform the analysis. In general, damage analysis works best with >1,000 aligned sequences, so observing this pattern simply means that more sequencing is needed. A similar pattern can also result if ultrashort DNA sequences (<30 bp) are not removed from the dataset prior to analysis; because ultrashort DNA sequences of this length are taxonomically non-specific, they can misalign to the reference genome, introducing noise. The data in Figure 2.17 (panel C) exhibits an ancient DNA damage pattern at sequence termini but it also has an elevated damage baseline, which suggests that the wrong reference genome was used. This is a common problem in studies of ancient bacteria in which the correct reference genome might not be known or available. For example, imagine that a sample of archaeological dental calculus contains Streptococcus sanguinis, but you align the data to the reference genome for Streptococcus mitis, a different but related species. The reference genome is close enough to produce a damage plot, but the elevated baseline alerts you to the fact that the selected reference genome is incorrect. To remedy this, a closer reference genome should be selected. However, if not available, the aDNA can also be assembled into contiguous sequences, or contigs, and the reads mapped back to these contigs to provide a damage estimate (Borry et al. 2021); this method requires deep metagenomic sequencing, but it is the most reliable way to estimate damage for ancient microbial taxa with inadequate genomic representation in public data repositories. Finally, Figure 2.17 (panel D) shows the expected pattern of DNA damage for a dataset that contains authentic ancient DNA, is sufficiently powered (has enough DNA sequences for analysis), and is aligned to the correct reference genome.
At this point, you may be wondering whether it is possible to use DNA damage as a clock. If so, that would make DNA damage very useful for dating ancient remains; however, the answer seems to be sort of, but not really. DNA damage is more like a clock that just says “today” or “a while ago”. The relationship between time and DNA damage is not linear, but rather is highly dependent on environmental factors like local temperature and humidity that speed up or slow down the processes of hydrolytic attack and depurination that cause DNA damage. Examining real examples of ancient DNA damage plots makes this clear. Figure 2.18, for example, shows cytosine deamination patterns that have been reported for Neanderthal and human remains from Europe. The Neanderthal remains are >40,000 years old and they have a 0.45 terminal substitution rate, indicating that ~90% of the original DNA fragments contained damaged cytosines. Younger remains from Neolithic Scandinavia dating to around 5,000 years ago had a lower terminal substitution rate of ~ 0.25-0.35 (Skoglund et al. 2014). In contrast, far younger samples in Costa Rica dating to only around 1,000 years ago have terminal substitution rates of >0.45 (Morales-Arce et al. 2017), indicating that as much or more deamination damage has accumulated in these tropical individuals in just one thousand years as in Neanderthals who are >40,000 years older (Figure 2.18). Thus, while DNA damage accumulates over time, it is heavily influenced by temperature and humidity in a way that prevents it from being used as a simple clock.

Efforts have been made to model these factors in order to better predict DNA damage rates in different locations and under different conditions (Allentoft et al. 2012; Kistler et al. 2017; Smith et al. 2003), and while some broad patterns are clear, such as DNA degrading faster in hot and humid environments than in permafrost and dry caves, accurately predicting specific rates of DNA decay is notoriously difficult (Bokelmann, Glocke, and Meyer 2020). Many environmental factors operate at hyperlocal scales and can cause variation in DNA preservation within a single burial context (Jeong et al. 2016), across a single sediment block (Massilani et al. 2022), among bones and teeth within a single skeleton (Gamba et al. 2014; Parker et al. 2020; Hansen et al. 2017), or even within a single bone (Prüfer et al. 2017; Hajdinjak et al. 2018).
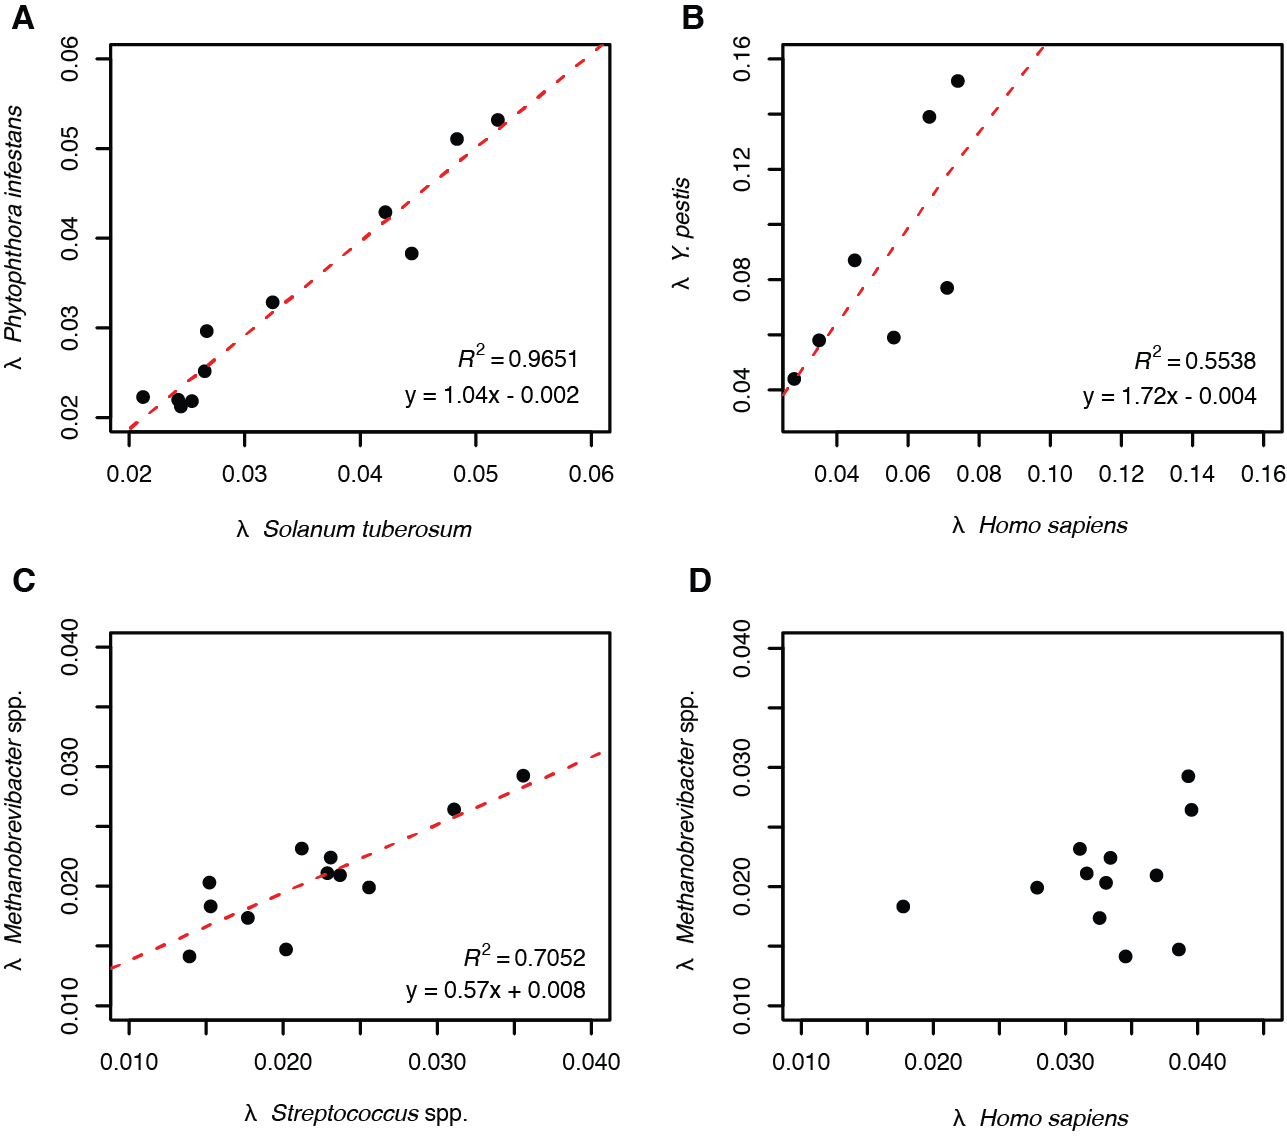
Another important factor to keep in mind is that not all organisms undergo DNA degradation and fragmentation at the same rate, even if they originate from the same sample. This can be readily seen by examining the DNA fragment rate 𝝺 (Kistler et al. 2017) in archaeological samples that are known to contain multiple species (Warinner et al. 2017). For example, in an examination of a 19th century herbarium specimen of potato (Solanum tuberosum) infected with fungal pathogen known as potato blight (Phytophthora infestans), a similar DNA fragmentation rate was observed for both species (Figure 2.19, panel A). However, in a human tooth infected with the plague pathogen Yersinia pestis, Y. pestis DNA was found to fragment at a faster rate than human DNA (Figure 2.19, panel B). In dental calculus, which contains the genomes of many species, it has been observed that DNA from oral bacteria such as Streptococcus spp. fragments at a faster rate than DNA from oral archaea such as Methanobrevibacter spp. (Figure 2.19, panel C), suggesting that differences in cell membrane stereochemistry between bacteria and archaea may influence the rate of DNA decay. However, in the same dental calculus samples no relationship was observed between the DNA fragmentation rates of Methanobrevibacter spp. and human host DNA (Figure 2.19, panel D). Thus, while DNA damage does accumulate over time, the rate of degradation can vary across time and space, and even among different organisms within the same sample (Warinner et al. 2017). For these reasons, patterns of DNA damage are typically only compared in a relative manner and not used to predict absolute sample age.
2.7.3 Removing DNA damage
Up to this point, we have primarily discussed how molecular damage can be useful for authenticating ancient DNA. However, once the authenticity of the DNA sequences has been established, it may be useful or even necessary to remove some of this damage - specifically cytosine deamination - before proceeding to downstream analyses like taxonomic classification, metagenomic assembly, strain separation, genome phasing, genotyping, or tree-building. Fortunately, there are multiple laboratory-based and bioinformatic-based strategies available to remove molecular damage from your ancient DNA sequences.
Laboratory-based strategies focus primarily on removing or reducing cytosine deamination from the physical ancient DNA fragments themselves. In 2010, Adrian Briggs and colleagues developed the first enzymatic process for removing uracil-bearing DNA from ancient DNA fragments, focusing initially on ancient DNA from mammoths and Neanderthals (Briggs et al. 2010). In this approach, ancient DNA fragments are phosphorylated using polynucleotide kinase (PNK) and then a two enzyme cocktail named Uracil-Specific Excision Reagent (USER) is applied. The first enzyme, uracil-DNA glycosylase (UDG), locates and removes uracils from the DNA fragments, leaving abasic sites. The second enzyme, endonuclease-VIII, then clips the phosphate backbone at these sites. Because most uracils in ancient DNA are found on single-stranded overhangs, this effectively clips off these damaged ends of the molecules. USER treatment can be advantageous because it removes all of the uracils from a DNA extract, but it also shortens the molecules at the same time. After USER treatment, only the DNA sequences between the innermost uracils of the original aDNA template molecules are likely to be built into a successful DNA library (Figure 2.20, panel A). Damage profiling after USER treatment results in plots with no visible enrichment of base misincorporations (Figure 2.20, panel B).
More recently, a modified form of USER treatment known as partial-USER treatment was developed to remove most, but not all, of the uracils in an ancient DNA extract (Rohland et al. 2015). This is achieved by not adding PNK prior to USER treatment and also using a shorter USER incubation time. UDG efficiently excises uracils at most positions, but experimental studies have shown that it will not excise the 5’ terminal uracil if it is unphosphorylated (Varshney and Sande 1991). By excluding PNK from the USER treatment, these terminal uracils are selectively retained in the ancient DNA fragment, whereas most other uracils are removed (Figure 2.20, panel C). Partial USER treatment also fails to remove terminal 3’ uracils, but because 3’ overhangs are removed by T4 polymerase during double-stranded library end repair, they are not observed in downstream damage plots. Within ancient DNA, most 5’ terminal uracils are believed to be phosphorylated, even without PNK treatment, and thus are excised during partial USER treatment. However, a minority of 5’ terminal uracils are unphosphorylated and thus are shielded from excision during partial USER treatment. Through this selective uracil excision, the partial UDG approach provides the advantage of retaining a damage signal in the sequences (for authentication), but limiting it to a predictable location where it can be easily bioinformatically masked or removed for downstream data analysis. As a result, the same DNA library can be used for both authentication and data analysis. Damage profiling after partial UDG treatment results in a plot where only the terminal base at each end of the DNA molecule shows evidence of misincorporation (Figure 2.20, panel D). For ancient DNA, partial UDG-treated libraries will always have a terminal misincorporation rate and an average fragment length that is intermediate between USER-treated and non-USER treated libraries. Typically, the 5’ terminal misincorporation rate of a partial USER-treated library is approximately one third that of a non-USER treated library (Rohland et al. 2015).

In addition to removing DNA damage, USER treatment also provides an additional benefit in ancient DNA studies by allowing states of epigenetic transcription regulation, such as gene silencing, to be identified. Within mammals, cytosine-guanine dinucleotide repeats are abundant within gene promoters, and 70-80% of the cytosines in these pairs are methylated in the form of 5-methylcytosine (Blackledge and Klose 2011). Concentrations of these repeats, known as CpG islands, play important roles in transcription regulation, and the presence of many 5-methylcytosines within these islands is associated with gene silencing (Newell-Price, Clark, and King 2000). As shown in Figure 2.10, while age-related deamination of cytosine produces uracil, deamination of 5-methylcytosine produces thymine. Thus, if USER treatment is applied to ancient DNA, C→T miscoding lesions due to cytosine deamination are removed, but C–>T miscoding lesions due to 5-methylcytosine deamination remain, allowing patterns of gene silencing to be explored in ancient genomes (Briggs et al. 2010; Hanghøj and Orlando 2019). If necessary, one can even reconstruct damage patterns from USER-treated libraries by quantifying 5-methylcytosine deamination at CpG sites; however, this generally requires many aligned sequences to be feasible.
2.7.4 Single-stranded library preparation
Until now, we have focused our discussion on ancient DNA libraries constructed using a double-stranded preparation method, the standard approach for building DNA libraries for high-throughput sequencing. This approach was adapted into a protocol specifically for ancient DNA by Matthias Meyer and Martin Kircher in 2010 (Meyer and Kircher 2010), and today there are several double-stranded library protocols suitable for ancient DNA in use (Carøe et al. 2018; Fellows Yates, Aron, et al. 2021; Harkins et al. 2020). These approaches are very similar to those used for modern DNA but with a few key differences: first, they generally employ blunt-end ligation because T/A ligation has been shown to induce undesired effects such as GC bias and other artifacts in library construction for ancient DNA (Seguin-Orlando et al. 2013); and second, they typically do not employ a mechanical or enzymatic shearing step (Meyer and Kircher 2010). Shearing is generally unnecessary for ancient DNA because it is already fragmented to sizes within the optimal range for short read sequencing (i.e., <600 bp), and the avoidance of shearing further prevents high molecular weight contaminant DNA from being successfully built into libraries, thereby reducing modern contamination in the libraries. Other protocol steps sometimes applied during modern DNA library construction (e.g., enzymatic tagmentation, size-selective purification, use of uracil-bearing hairpin adapters, commercial single-tube protocols) are not suitable for ancient DNA as they are likely to fail, introduce biases, or enrich for contamination when applied to highly fragmented, low molecular weight ancient DNA (Carøe et al. 2018; Kapp, Green, and Shapiro 2021).
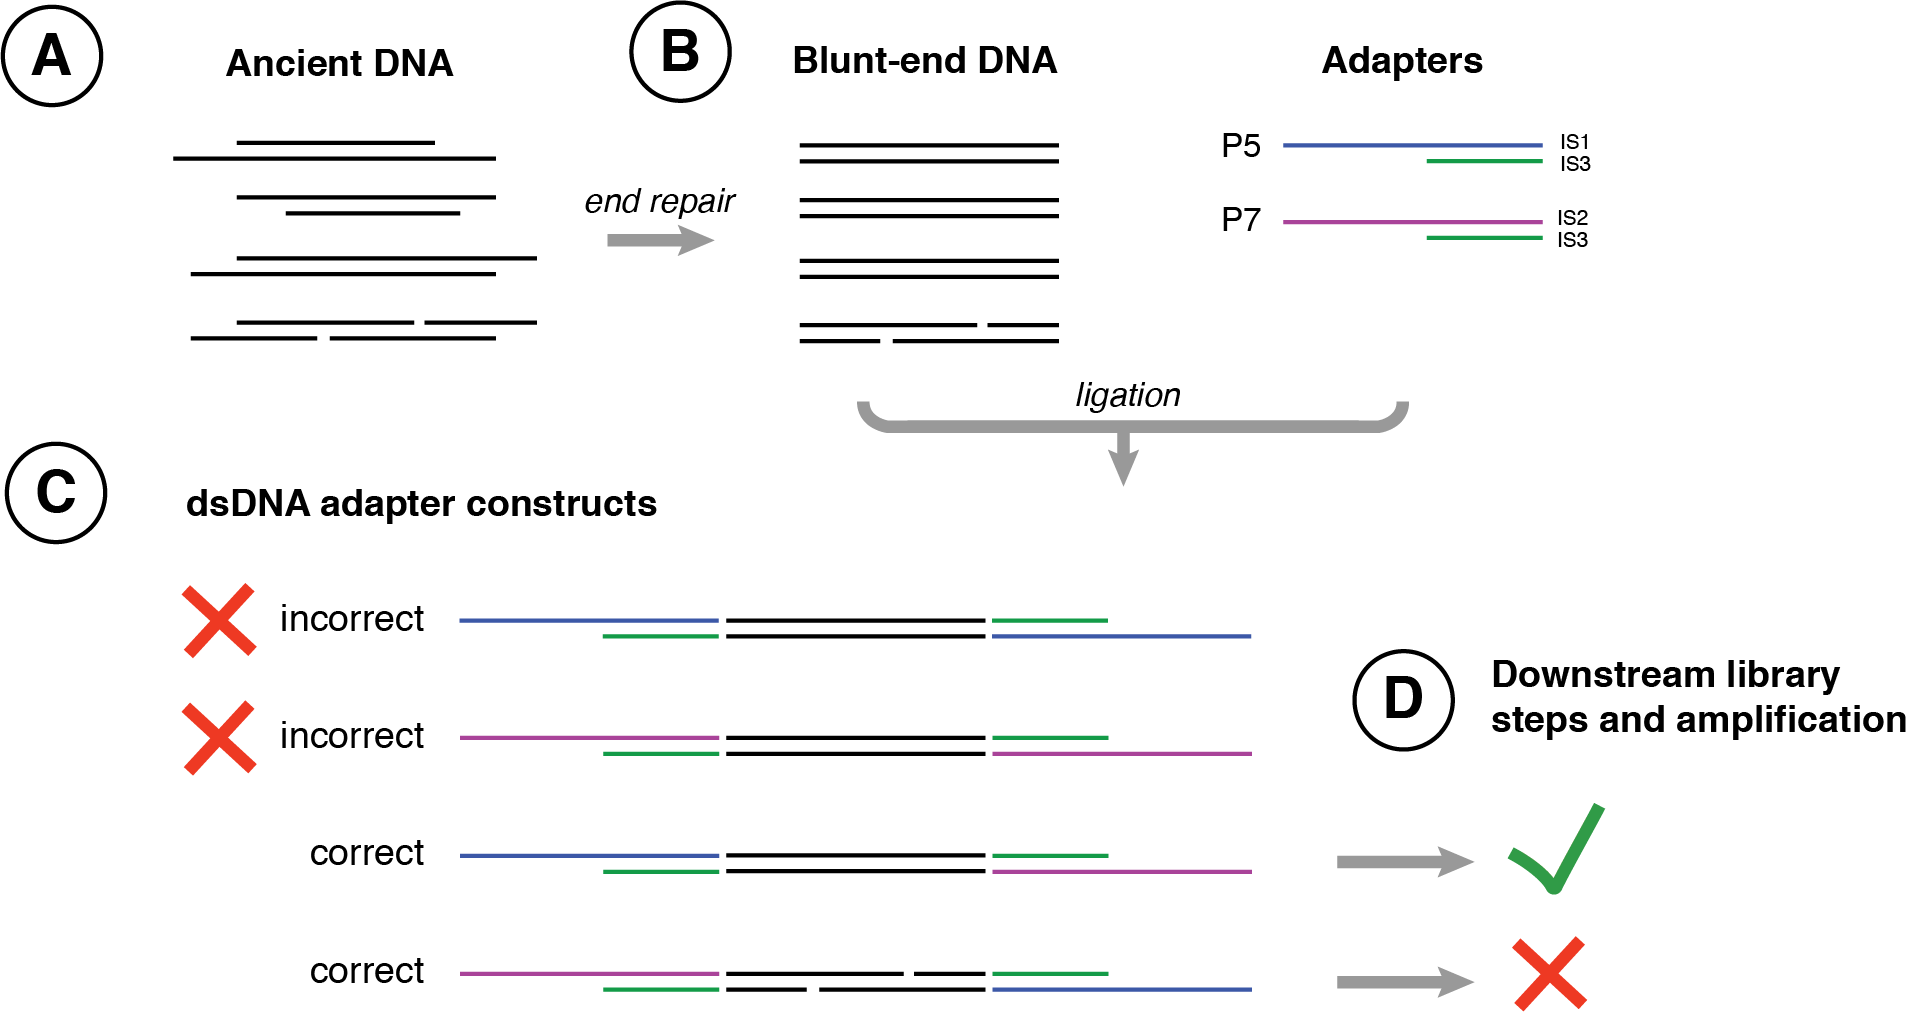
While double-stranded preparation methods can be used to build successful DNA libraries from ancient DNA, they include several steps that disadvantage ancient DNA and can lead to reduced library construction efficiency. For example, because the blunt-end ligation step is non-directional, approximately half of the library will be improperly constructed and consist of DNA molecules containing either only a P5 (IS1/IS3) or only P7 (IS2/IS3) adapter configuration instead of the desired combination of one P5 (IS1/IS3) and one P7 (IS2/IS3) adapter2 (Figure 2.21). Such improperly constructed molecules will not be sequenced. While such a loss is generally trivial for modern DNA, it can be highly consequential for ancient DNA, particularly for samples with very low DNA abundance or low molecular complexity. Further losses occur for ancient DNA molecules containing intra-strand nicks, as these will also fail to amplify properly during the library amplification stage, resulting in further library loss. Finally, the many purification steps required during double-stranded library preparation methods lead to yet more DNA losses, as short DNA fragments are only inefficiently retained by binding to silica or carboxylated beads during these cleaning steps. The development of new single-tube protocols substituting heat denaturation for washing during double-stranded library preparation (Carøe et al. 2018) mitigates some but not all of these losses.
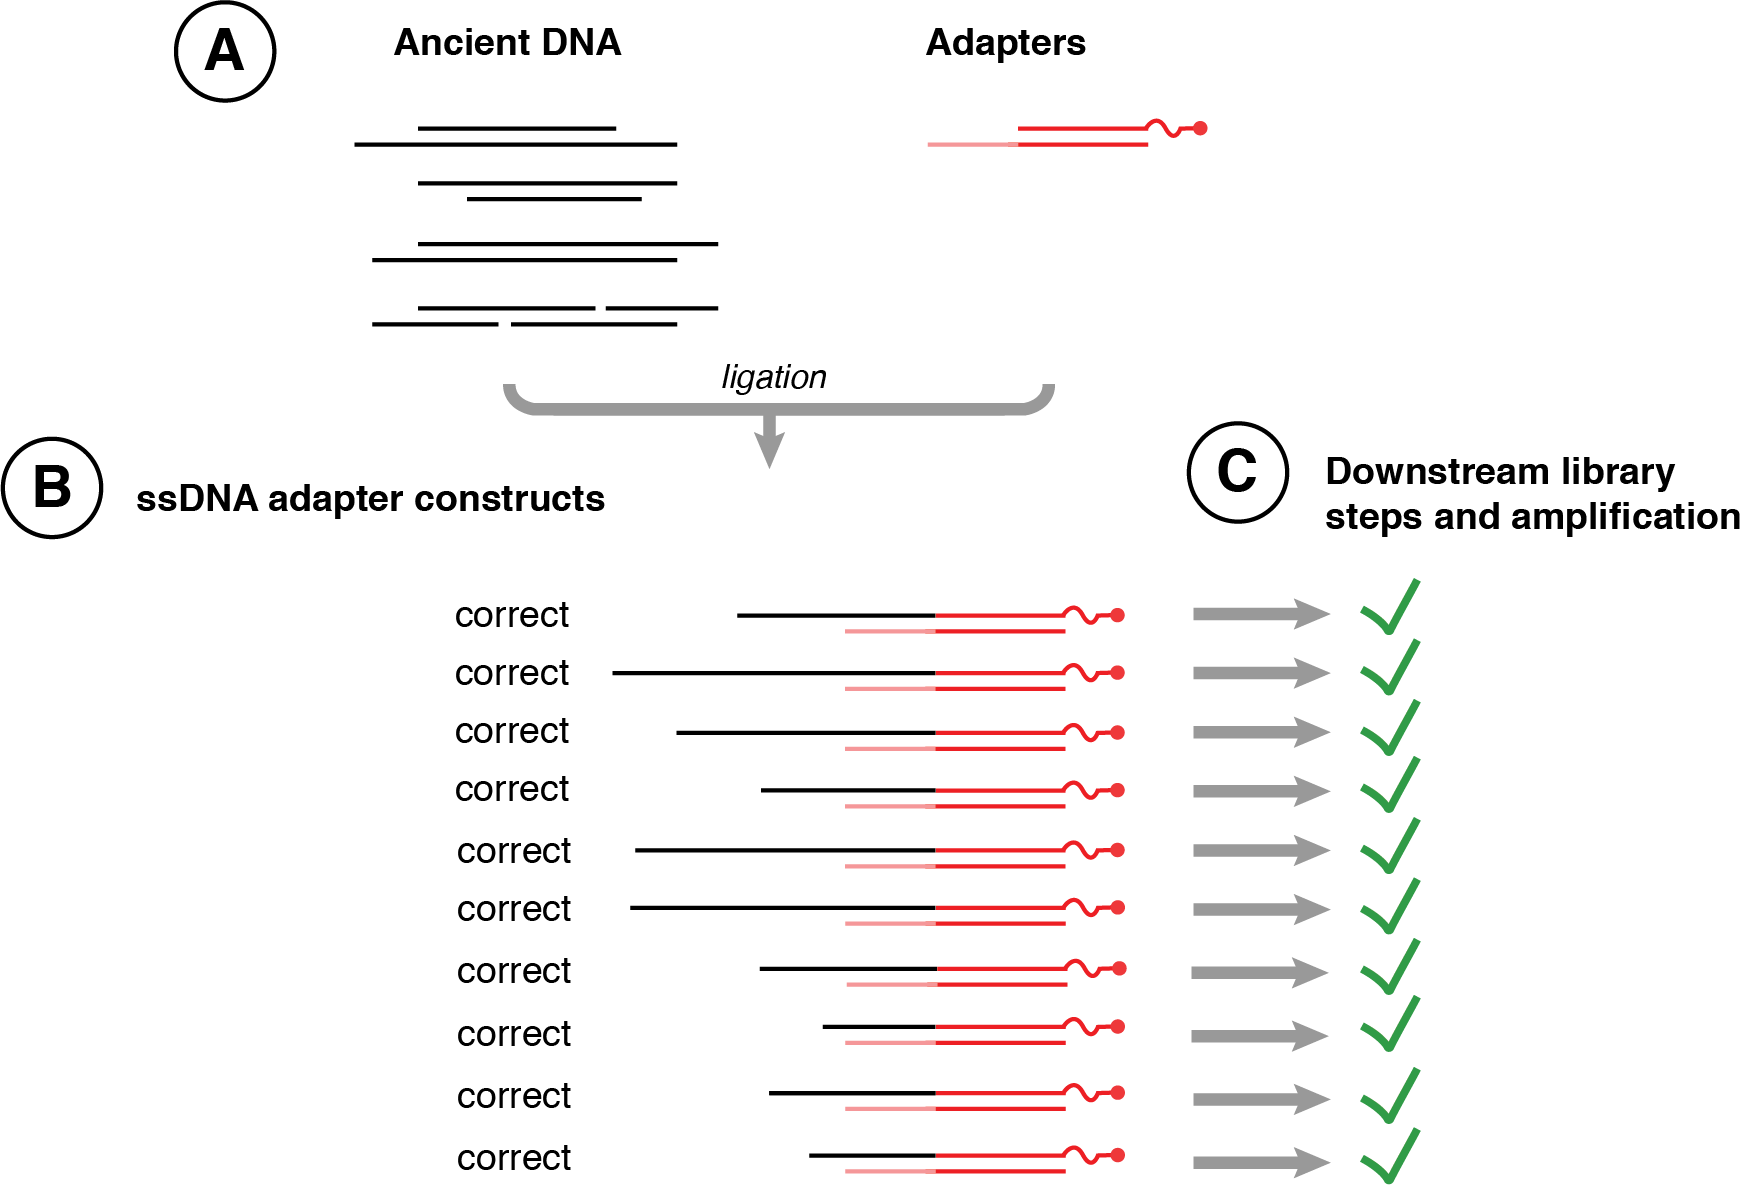
To address such issues, a single-stranded library preparation method was developed in 2012 for use on highly degraded Denisova remains (Meyer et al. 2012), and then formalised as a protocol by Marie-Theres Gansauge and Matthias Meyer in 2013 (Gansauge and Meyer 2013), and later refined into protocol ssDNA2.0 in 2017 (Gansauge et al. 2017) and automated for robotics in 2020 (Gansauge et al. 2020). This method first heat denatures ancient DNA into single-stranded fragments and then tightly binds these fragments to streptavidin beads, allowing a substantially more controlled and efficient library construction (Figure 2.22). Optionally, ancient DNA can be pretreated with Endonuclease VIII to create nicks at abasic sites prior to single-stranded library preparation in order to avoid polymerase stalling during library amplification (Gansauge and Meyer 2013; Psonis, Vassou, and Kafetzopoulos 2021), but this step generally provides little empirical benefit and so it is no longer implemented in current protocols (Gansauge et al. 2017). In studies of a wide variety of ancient DNA sources (Bennett et al. 2014; Gansauge and Meyer 2013; Wales et al. 2015), the single-stranded library preparation method was found to result in major improvements in DNA recovery, and in some cases an improved endogenous DNA recovery. However, single-stranded library preparation methods are also known to produce libraries with shorter median DNA fragment lengths (Bennett et al. 2014), likely due to the improved retention of very short DNA using streptavidin binding during washing steps and the recovery of nicked DNA that was otherwise lost during double-stranded DNA library preparation methods. Libraries produced by single-stranded library preparation methods are typically 10-40 nucleotides shorter than libraries prepared using double-stranded library preparation methods, and while this poses few disadvantages for studies of large-bodied eukaryotes with well characterised reference genomes, it can introduce challenges for studies of microorganisms where DNA length is important for species deconvolution and de novo genome assembly from large metagenomics datasets (Koren and Phillippy 2015; Kingsford, Schatz, and Pop 2010; Jiang et al. 2012). Currently, multiple single-stranded library preparation protocols are in use for ancient DNA (Gansauge et al. 2020; Gansauge and Meyer 2019; Kapp, Green, and Shapiro 2021).
2.7.5 Damage patterns in DNA prepared using single-stranded library protocols
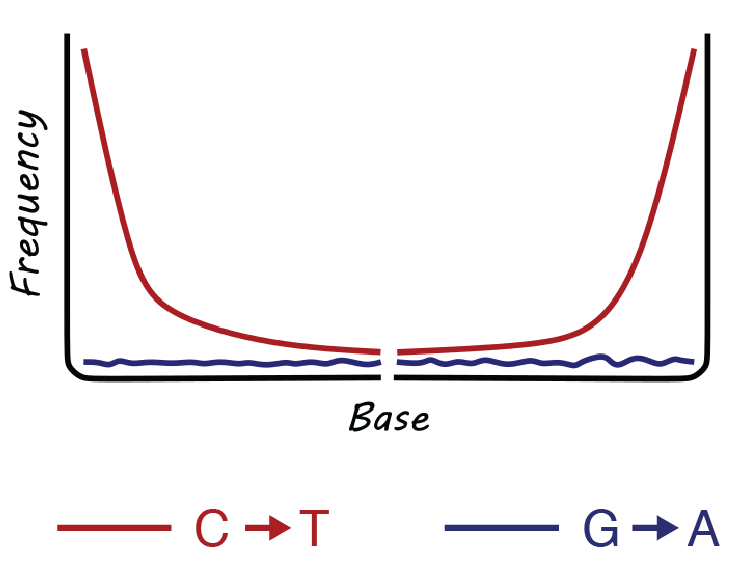
An important feature of single-stranded library preparations is that they do not involve an end-repair step, and consequently damage on the 3’ end of the DNA molecule is retained. As a result, uracils can be present on both the 5’ and 3’ ends of the DNA molecule and adenines are not misincorporated on the 3’ end. Thus, damage plots for ancient DNA prepared using single-stranded library protocols will show an enrichment of C to T substitutions on both the 5’ and 3’ ends (Figure 2.23). Optionally, USER treatment or partial-USER treatment can be applied to ancient DNA prior to single-stranded library preparation (Psonis, Vassou, and Kafetzopoulos 2021; Gansauge and Meyer 2013), although this is less commonly performed for single-stranded library preparations than for double-stranded library preparations, in part because it can result in libraries with high proportions of DNA <30 bp long.
2.7.6 Damage plot review
Having now examined DNA damage in detail, let’s now review again the most common damage patterns likely to be encountered in ancient DNA studies and what they signify (Figure 2.24). The first plot (Figure 2.24, panel A) shows no misincorporation; this is the pattern expected for modern DNA or ancient DNA that has been USER-treated. The second plot (Figure 2.24, panel B) shows a spiky profile indicating that the analysis is likely underpowered and requires more DNA sequences to make an accurate damage plot. Alternatively, there may be residual ultrashort DNA sequences (<30 bp) in the dataset causing noise; if present, these should be removed and the analysis repeated. The third plot (Figure 2.24, panel C) looks like an expected ancient DNA profile for a library prepared using a double-stranded library preparation method, except that it has an elevated baseline. This indicates that the reference genome used for the analysis is incorrect. To remedy this, a closer reference genome should be selected, or may be created through metagenomic assembly. The fourth plot (Figure 2.24, panel D) shows an expected ancient DNA profile for a library made with a double-stranded library preparation method and using an appropriate reference genome. The fifth plot (Figure 2.24, panel E) shows a typical DNA damage pattern for ancient DNA treated with the partial-USER protocol, followed by a double-stranded library preparation. Finally, the sixth plot (Figure 2.24, panel F) shows an expected DNA damage profile for ancient DNA that has been prepared using a single-stranded library preparation method.
2.7.7 Enzyme alert
At this point, we have only briefly discussed the role of DNA polymerases in DNA library preparation methods, but selection of appropriate DNA polymerases is a critical step in all ancient DNA studies. This is in large part because DNA polymerases greatly differ in how they respond to uracil, a key form of DNA damage present in ancient DNA (Heyn et al. 2010). In life, uracils are an essential component of RNA, where they are one of the four bases that make up the RNA code. Its counterpart in DNA is thymine, a chemically similar base that differs only in a single methyl group (Figure 2.10). Although not typical of DNA, uracil can spontaneously form in DNA through various enzymatic errors and chemical damage, but such uracils are rapidly removed by cellular repair enzymes, including uracil-DNA glycosylases (UDG) (Kavli et al. 2007; Krokan, Drabløs, and Slupphaug 2002; Visnes et al. 2009).
Because of the close chemical similarity between uracil and thymine, most DNA polymerases are unable to distinguish between the two bases, treating both as a thymine. Such DNA polymerases are called non-proofreading enzymes. T4 polymerase is one such non-proofreading enzyme, and this is why T4 polymerase incorporates a complementary adenine for each uracil it encounters when repairing 5’ overhangs, thus preserving the C to T damage signal. However, not all DNA polymerases treat thymines and uracils as equivalent. Some DNA polymerases simply stall at uracil positions, either stopping or disengaging from the DNA strand. Such enzymes belong to a group known as proofreading enzymes. Proofreading enzymes are characterised by their ability to recognise misincorporated nucleotides during DNA replication. Only archaea produce the proofreading DNA polymerases capable of recognizing uracil (Wardle et al. 2008), and most proofreading enzymes used in molecular biology are derived from the archaeal species Pyrococcus furiosus (the source of Pfu and Phusion enzymes).
It is important to know that many commercial library preparation kits developed for modern DNA cannot be used for ancient DNA because they incorporate proofreading enzymes that stall at uracil sites (Kapp, Green, and Shapiro 2021), causing ancient DNA libraries to become depleted in damaged sequences and resulting in library failure, skewed damage profiles, or a bias towards undamaged contaminant sequences. It is essential to ensure that only non-proofreading DNA polymerases are used during the end-repair and subsequent PCR steps of ancient DNA library preparation, and it is only after the damage signal has been “locked in” by placing complementary adenines opposite each uracil during these repair/replication steps that proofreading enzymes can be used for subsequent steps. USER-treated ancient DNA represents a special case; if uracils are fully removed during USER treatment, USER-treated ancient DNA is compatible with the use of proofreading DNA polymerases during all stages of library preparation. Knowing how different DNA polymerases react to uracil and choosing the appropriate enzyme to use at each step of DNA library preparation is critical for the successful recovery and sequencing of ancient DNA.
After learning of the dangers in using proofreading enzymes during ancient DNA library preparation, one might wonder why proofreading enzymes are used at all. The reason is because they are more accurate, and when used judiciously they can improve the sequence fidelity of your DNA datasets. In a typical ancient DNA workflow, end-repair is performed using the non-proofreading enzyme T4 polymerase, and the indexing PCR is performed using a non-proofreading DNA polymerase, such as Platinum Taq or Pfu Turbo Cx (an archaeal enzyme that has been modified to remove its uracil recognition domain). Once these steps are complete, the resulting DNA library can be subsequently treated like modern DNA and high fidelity proofreading enzymes, such as Herculase II Fusion or Phusion HS II, can be used for all subsequent amplifications, reamplifications, and reconditioning steps in preparation for downstream analyses, such as DNA-capture enrichment or DNA sequencing.
2.8 Ancient microbes: a 60,000 piece jigsaw puzzle
Earlier, we discussed how ancient DNA is like the world’s worst jigsaw puzzle and that reconstructing human chromosome 1 from ancient DNA is like trying to assemble a puzzle from 5 million pieces. The problem is not quite so immense for microbes because their genomes are much smaller. So rather than having a 5-million-piece puzzle, reconstructing a typical bacterial genome is more like working with a 60,000-piece puzzle. However, this is admittedly somewhat misleading because ancient microbial species are almost never found in isolation; instead ancient microbes are usually found communities comprising tens to thousands of distinct species, so a more realistic metaphor would be one in which you attempt to reconstruct a hundred mixed-up 60,000-piece puzzles simultaneously. And, making things even worse, some of these puzzles are present more than once.
Taking a step back, let’s examine the important role of DNA damage in studies of ancient DNA. Why does DNA damage matter so much? DNA damage is useful because it allows for the authentication of ancient DNA at the level of species (Jónsson et al. 2013), contigs (Borry et al. 2021), and even individual sequences (Skoglund et al. 2014). In studies of plague, for example, DNA damage has been used to support the ancient origin and authenticity of reconstructed Yersinia pestis genomes (Andrades Valtueña et al. 2022; Rascovan et al. 2019; Rasmussen et al. 2015; Spyrou et al. 2018). Likewise, DNA damage has been used to support the metagenomic assemblies of fecal bacteria in ancient palaeofaeces (Borry et al. 2020; Maixner et al. 2021; Wibowo et al. 2021), and to authenticate atypical taxa of Pleistocene origin in ancient dental calculus (Klapper et al. 2023). DNA damage can also aid in the correct identification of low abundance pathogens by confirming that damaged sequences show appropriate edit distance profiles for the taxon of interest (Hübler et al. 2019).
Nevertheless, DNA damage also poses taxonomic challenges for studies of ancient microbes, especially as it relates to the correct identification of specific taxa, the accurate mapping of microbial genomes, and successful reconstruction of metagenomically assembled genomes (MAGs). However, it has become apparent that the greatest challenge for reconstructing ancient microbes and their communities is not cytosine deamination, but rather DNA fragmentation. Cytosine deamination has been shown to only minimally impact taxonomic assignment (Velsko et al. 2018), and some de novo assemblers (e.g., MEGAHIT) are relatively robust to substitution errors (Klapper et al. 2023). Moreover, cytosine deamination can be removed or mitigated through USER-treatment, or identified and corrected bioinformatically through deeper sequencing and high coverage genome generation. DNA fragmentation, however, remains a serious and insoluble problem. Ancient DNA is simply very short, and this makes ancient metagenomics more difficult.
Very short sequences often cannot be uniquely assigned to specific strains or species, leading to ambiguous or false taxonomic assignments in read-based analyses, and sequences less than 250 bp typically produce complex assembly graphs with short contigs and a low N50 (length of the shortest contig needed to account for at least 50% of the total assembly). DNA sequence length is also one of the most important factors affecting ancient DNA assembly success. While some sources of ancient microbial DNA, such as palaeofaeces in very dry caves, have been found to have long median DNA fragment lengths of ~175 bp (Wibowo et al. 2021), most ancient microbial DNA is very short and similar to other sources of ancient DNA. The tipping point for ancient DNA studies occurs when DNA fragments become shorter than 30 bp. Such ultrashort fragments lack sufficient specificity for taxonomic or even genetic placement as they align to too many genomes with no phylogenetic coherence. Thus, DNA degradation imposes some hard limits on the study of ancient microbial DNA.
2.8.1 The limits of ancient DNA
What are the theoretical limits of ancient DNA? DNA decay modeling has predicted an approximately 3-million-year limit for ancient DNA studies – not because DNA does not survive beyond 3 million years, but rather because it is unlikely to survive in fragments of >30 bp beyond 3 million years, even under ideal conditions. In a study of DNA decay rates, Morten Allentoft and colleagues estimated the half-life of a 30 bp DNA fragment to be 158,000 years at -5˚C (Allentoft et al. 2012). For a genetic sample with a starting amount of 1 million DNA molecules, this would mean that no DNA fragments of this length would be left after a period of ca. 3.3 million years. Moreover, they estimate that after 6.8 million years, the average length of ancient DNA would be 1 bp. Such models place deep time palaeobiology outside the realm of palaeogenomics, at least using current in-solution methods in which any spatial information still retained by DNA molecules in its parent substrate is lost during extraction, library preparation, and sequencing.
Three recent ancient DNA studies, each focusing on remains in permafrost, seem to confirm these estimates. The first, a study of mammoths dating to the Early and Middle Pleistocene (Valk et al. 2021), reported that the recovered DNA was exceptionally short (mostly <35 bp) and nearly saturated with cytosine deamination at the terminal 5’ position. The two oldest mammoths in the study, dating to ca. 1.1 Mya, are the currently oldest eukaryotic genomes to be successfully reconstructed using ancient DNA. The two other studies focused on ca. 2 Mya eDNA recovered from deep subsurface permafrost sediments in Greenland, and they identified diverse ancient plant and animal (Kjær et al. 2022) and microbial and viral (Fernandez-Guerra et al. 2023) DNA sequences. Analysis of the ancient plant and animal DNA has allowed the reconstruction of Late Pliocene and Early Pleistocene environments in Greenland, while the recovered microbial and viral DNA provides insights into the soil microbial ecology of this period. As with the mammoth study, eukaryotic DNA from the sediment cores was found to be mostly <35 bp in length and nearly saturated with cytosine deamination at the terminal 5’ position, suggesting the ancient DNA in these samples falls near the limit of sufficient DNA preservation for palaeogenomic analysis. The microbial DNA was slightly more intact, likely reflecting an extended period of microbial survival in subsurface habitats, as is expected for environmental microbes in geological contexts.
2.9 Summary
The study of ancient DNA has changed enormously since its beginnings in the 1980s. Gone are the days of electrophoretic gels and rulers for ancient DNA sequencing. Today we have instruments capable of churning out more than 50 billion ancient DNA sequences in a single 48-hour run. This means that aspiring archaeogeneticists need to have a solid foundation in computer science and a proficiency in coding and scripting in languages such as R and Python. During life, genomes are large high molecular weight molecules, but they fragment into thousands or millions of pieces once an organism dies. The very short and ultrashort fragment lengths of ancient DNA makes taxonomic identification, genome mapping, and metagenomic assembly more challenging than for modern DNA, and ancient DNA analysis generally requires the use of specialised software or parameter modifications to account for these differences. Robust and powerful tools now exist to characterise the chemical damage that accumulates in ancient DNA, and factors such as fragment length and cytosine deamination can be used to authenticate ancient DNA, but not provide a precise age estimate. Studies of ancient DNA require specialised laboratories and library protocols in order to appropriately manipulate and handle ancient DNA, and we now have options to remove or mitigate some forms of DNA damage through USER-treatment, or we can choose to maximise recovery of DNA damage through the use of single-stranded DNA library protocols. DNA fragmentation remains the biggest challenge in ancient metagenomics, but tremendous strides in ancient DNA laboratory and bioinformatics methods, in parallel with massive gains in sequencing technology, have broadened the scope of palaeogenomics studies to an enormous diversity of sample types, environments, and applications over the past 3 million years.
2.10 References
Temperatures calculated using the IDT Oligoanalyser tool (https://eu.idtdna.com/calc/analyser).↩︎
See (Meyer and Kircher 2010) for an explanation of adapter and primer nomenclature for double-stranded library preparation.↩︎